
An Update on Housing Production's Affect on Public School Enrollment
This is an updated report of "The Waning Influence Of Housing Production On Public School Enrollment," released in October 2017.
A Metropolitan Area Planning Council Research Brief
Authors: Brandon Stanaway
Data Services Department
February 2024
Introduction
The concern that constructing new housing will drive up school enrollment is long-standing and widespread in local debates about new residential development and zoning reform in Massachusetts, especially in suburban communities. Many local officials and residents assume that new housing, and especially new multifamily housing, will attract families with children who will inevitably increase enrollment in the local public schools, thus burdening school budgets and municipal finances.
In 2017, MAPC analyzed the relationship between housing development and school enrollment in municipalities across Massachusetts. Our findings, consistent with other studies,[1] indicated that concerns about those impacts are overstated. We found no association between increased housing unit development and school enrollment. With this topic at the forefront of many municipal conversations about Massachusetts’ MBTA Communities Multifamily Zoning requirements, MAPC has updated our research with the latest data from the 2020 decennial census and school enrollment data from the Department of Elementary and Secondary Education (DESE). We have examined changes in housing units and school enrollment across 231[2] public school districts over the ten years prior to COVID, from 2010 to 2020.
We find that development of new housing units does not account for the changes in school enrollment in Massachusetts we’ve seen during our study period between 2010 and 2020. We find no significant association between the change in housing unit development and the change in school enrollment at the district level during this period. This lack of relationship holds at the community type, level too—we still see no clear association between development and enrollment when looking at clusters of similar suburban or urban municipalities. What is apparent, however, is that independent of housing development, school enrollment is changing meaningfully—there are some municipalities that have seen consistent enrollment growth and some that have seen consistent enrollment decline over the study period. Below, we identify community types where the change in school enrollment is significantly different from zero. The processes driving those changes are more complex than the number of housing units built in a municipality.
While it is true that schoolchildren occupying new housing units may cause a marginal change in enrollment, it is one factor among many others. MAPC has explored the underlying dynamics driving school enrollment change in a few individual municipalities as part of municipal planning work. These analyses find that demographic trends, parental preferences, and the characteristics and affordability of available housing often play a much larger role than housing development in enrollment growth and decline.
[1] Housing the Commonwealth’s School-Age Children The Implications of Multi-Family Housing Development for Municipal and School Expenditures, 2003, Community Opportunities Group, Inc. & Connery Associates; Citizens Planning and Housing Association (https://www.chapa.org/sites/default/files/f_1239203891HousingSchoolAgeChildren.pdf); The Costs And Hidden Benefits Of New Housing Development In Massachusetts Michael Goodman, Elise Korejwa, and Jason Wright; PPC Working Paper No. 02 March, 2016 https://www.mhp.net/assets/resources/documents/Cost_Benefit_new_housing_3-15-16.pdf)
[2] We excluded multi-municipal regional districts from our analysis so that it is clear that the students live and attend school in the same municipality.
Data
In the 2017 analysis we compared 2010 decennial census housing unit data with inter-decadal data sourced from the Census Building Permit Survey (CBPS). Since that time, the 2020 decennial census has been released. As discussed in the prior analysis, CBPS data provide an imperfect measure of actual housing unit growth: it excludes certain forms of housing unit creation, such as adaptive reuse of existing buildings; issuance of a building permit is no guarantee of unit production, since construction may be halted due to financial reasons at any time; and, perhaps most significant, numerous municipalities—including some that are known to be experiencing robust housing growth—fail to report building permits to the Census Bureau. Fortunately, with the release of the 2020 decennial census data, the information at our disposal more accurately reflects the true change in housing units within each municipality.
We’ve updated school enrollment by school district through the 2019/2020 school year. As we did in 2017, we’ve filtered out multi-municipal regional districts from the analysis, including those with secondary-only regional schools. This limits the number of municipalities covered in the research to 231 out of 351, but ensures that municipal housing development trends and school enrollment are directly compared.
Findings
Statewide, school enrollment, including local schools, regional school districts, and charter schools, continued to decline through the 2019/2020 school year, a mostly consistent trend since the 2005/06 school year. Between the 2010/11 and 2019/2020 school years, school enrollment declined 0.7 percent overall. There was slight growth in enrollment in the three school years from 2012/13 to 2014/15, but by the 2019/20 school year, Massachusetts was at a 15-year low in school enrollment. Some of this decline can be explained by changes in demographics; between 2010 and 2020, the population under 18 years of age declined by nearly 17 percent. Our study period ends in the 2019/2020 school year to be consistent with the decennial census years, but at the end of this post we have provided some insight into school enrollment trends following the COVID-19 pandemic.

As can be seen in the map of enrollment change by school district below, a dichotomy has emerged between districts which are adding and losing students. Of the 231 local school districts statewide, two-thirds (155) saw enrollment decline over the ten-year period and 80 percent (44) of the 55 multi-municipal regional school districts saw enrollment decline over the same time frame. These changes are polarized, too. Out of 76 local districts that saw enrollment growth between 2010 and 2020, 28 grew by over 10 percent. Of those that experienced a decline in enrollment, 22 out of 155 shrank by over 20 percent.
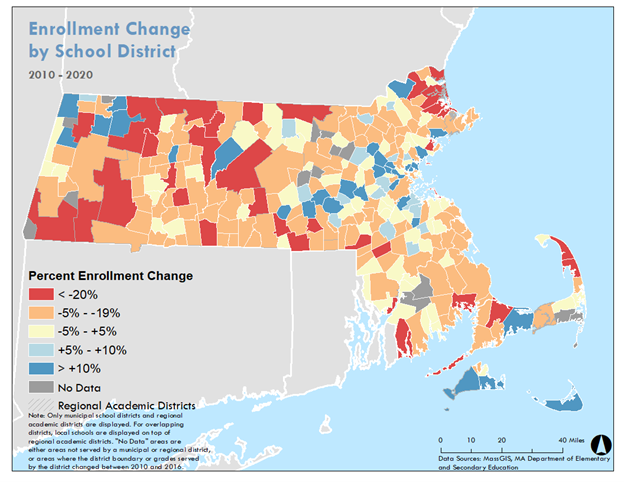
Enrollment in local school districts within the MAPC region, specifically, declined more slowly than statewide, declining by 0.3 percent. Not every type of community fared the same, though. Using MAPC’s Community Types, we find that within the MAPC region, Inner Core and Regional Urban Center school districts grew (over that same period) by 2.2 and 4.7 percent, respectively, while those in Maturing Suburbs and Developing Suburbs shrank by 2.5 and 8.2 percent, respectively.
Housing units, on the other hand, increased in each community type. Housing units grew by 7.9 percent between 2010 and 2020. Housing units in the Inner Core and Developing Suburb communities grew by 9.3 percent and 9.6 percent, respectively. Regional Urban Center and Maturing Suburb communities saw slower growth in housing units, increasing by 6.3 percent and 6.0 percent, respectively, between 2010 and 2020.
Figure 2
| Community Type | Housing Unit Change 2010-2020 | Enrollment Change 2010-2020 | Number of School Districts | Example Districts |
| Inner Core | 9.3% | 2.2% | 16 | Boston, Cambridge, Revere, Chelsea, Melrose, Arlington, Watertown, Milton |
| Regional Urban Centers | 6.3% | 4.7% | 11 | Lynn, Salem, Framingham, Quincy |
| Maturing Suburbs | 6.0% | -2.5% | 43 | Saugus, Lexington, Acton, Natick, Braintree |
| Developing Suburbs | 9.6% | -8.2% | 23 | Ipswich, Bolton, Holliston, Franklin, Norwell |
| All Districts | 7.9% | -0.3% | 93 |
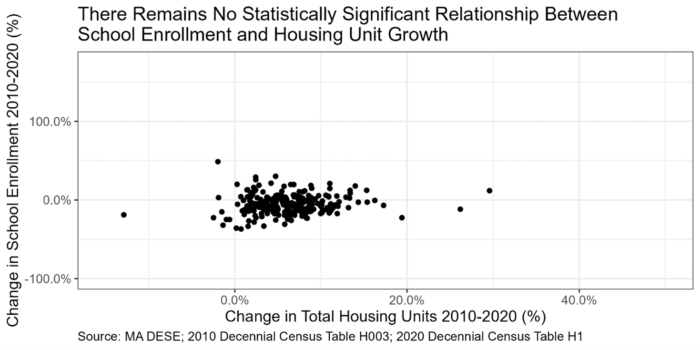
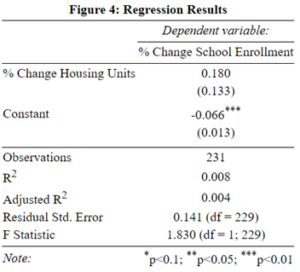
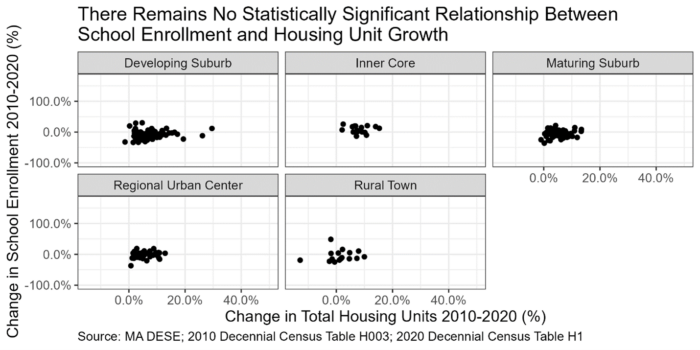
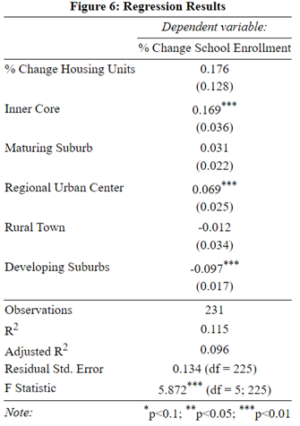
Using a linear regression to estimate the relationship between housing unit and school enrollment change statewide, we see no association between the percentage change in school enrollment between 2010 and 2020 and the percentage change in housing unit production between 2010 and 2020; in statistical terms, the association between the two variables is not different from zero. This finding holds statewide at the Community Type level. A linear regression incorporating information about the Community Type to which each district belongs finds no significant association between housing unit change and school enrollment change (see Figures 3 through 6).
Based on the intercepts of the regression estimation, we find that even if no housing was built, school enrollment would have changed meaningfully. Statewide, school enrollment would have, according to the model, declined 6 percent in the absence of any change in the number of housing units. This makes logical sense, given statewide demographic shifts. At the statewide Community Type scale, three Community Types also have intercept values statistically different from zero: the Inner Core, Developing Suburbs, and Regional Urban Centers. Their intercepts suggest that with no new housing unit development, school enrollment would have increased by 16.9 percent in the Inner Core, increased 6.9 percent in Regional Urban Centers, and decreased 9.7 percent in Developing Suburbs. Interpret these values to mean that if the percentage change in housing units between 2010 and 2020 were to be zero, the percentage change in school enrollment is, within a 99 percent confidence interval, not zero.
No discernable pattern is seen in the scatter plots of change in housing units and change in school enrollment below (Figures 3 and 5), other than perhaps the independent change in school enrollment. This is consistent with our previous analysis. An outlier was omitted from the scatter plot for legibility. Hancock, a small town of 760 people in Western Massachusetts, saw an 86 percent growth in housing units and only a 14 percent growth in its school enrollment, from 41 to 47 students.
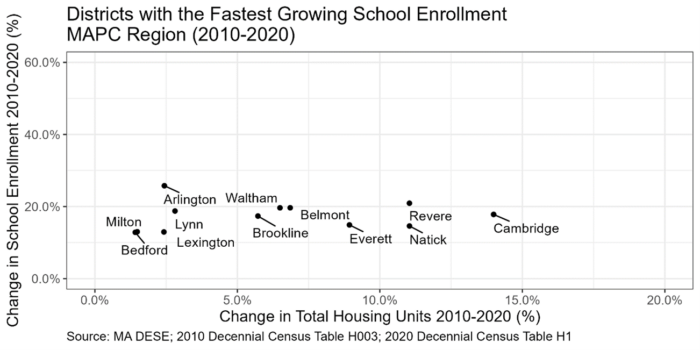
Additionally, we examined the 12 municipalities within the MAPC region with the fastest growing school enrollment between 2010 and 2020. On average, school enrollment in these communities has grown by 17.6 percent while housing unit development has been far more variable. Even communities like Milton and Bedford which added very few new housing units over this ten-year span (1.5 percent and 1.4 percent, respectively) saw upwards of a 13.0 and 12.8 percent increase in school enrollment, respectively.
Figure 7
Changes in Public and Charter School Enrollment as a Result of COVID
Across state public and charter schools, enrollment declined significantly during the school year beginning in the autumn of 2020. COVID-19 vaccines were unavailable, the virus was expected to run rampant during the coming winter, and parents and children shifted to remote education. Research now illustrates the deleterious educational outcomes3 of these necessary shifts during the pandemic which further widened gaps in educational achievement by race and income4. Overall, enrollment in Massachusetts during the 2020/21 school year declined by 4 percent relative to the previous school year, nearly 40,000 students. Year over year enrollment growth returned to levels similar to those seen before the pandemic once in-person instruction returned with the state experiencing positive enrollment growth over the past two school years (see Figure 8).
3 Goldhaber, Dan, Thomas J. Kane, Andrew McEachin, Emily Morton, Tyler Patterson, and Douglas O. Staiger. 2023. "The Educational Consequences of Remote and Hybrid Instruction during the Pandemic." American Economic Review: Insights, 5 (3): 377-92.
4 Jack, Rebecca, Clare Halloran, James Okun, and Emily Oster. 2023. "Pandemic Schooling Mode and Student Test Scores: Evidence from US School Districts." American Economic Review: Insights, 5 (2): 173-90.
Figure 8

Declining school enrollment in 2020 can be ascribed to modes of instruction adopted during the pandemic to attempt to stymie the spread of COVID in schools. In one study of Michigan public school enrollment trends during the pandemic, economists and education policy researchers found parents with students enrolled in Michigan public schools at the outset of the pandemic decided to home school children enrolled in elementary school and enroll middle and high school aged children in private schools5. Parents’ decision to homeschool elementary school aged children was driven by concerns about the spread of COVID among their children and doubts about the effectiveness of remote education. Parents of middle and high school aged children who shifted their enrollment to private schools during remote instruction may have believed that, all else equal, private schools could offer better remote instruction (based on available resources, teacher to student ratios, etc.) than public schools. Another study identified an association between public school districts that moved to and maintained fully remote instruction in the two school years immediately following 2020 and disenrollment of kindergarten and elementary school aged children6. The authors attributed this association to a parental preference for in-person instruction.
Research conducted by Boston Indicators corroborates the conclusion reached by the researchers studying enrollment declines in Michigan. Homeschooling increased by 120 percent between the 2019/20 and 2020/21 school years across all grade levels in Massachusetts7. Enrollment in pre-K and Kindergarten decreased by 30.8 and 11.9 percent, respectively, across all Massachusetts public schools.8 Enrollment in ninth grade fell by 3.2 percent while enrollment for all other grade groups in high schools saw little to no change. Ninth grade enrollment may have changed for the same reasons identified in the study of Michigan students; students may have shifted to private schools motivated by perceived higher quality remote instruction. As vaccine usage became more widespread in the 2021/22 school year, pre-K and Kindergarten enrollment in schools across Massachusetts saw a rebound -- additional evidence to suggest disenrollment was partially driven by health concerns.
Most concerning, currently, is the persistence of the disenrollment caused by the pandemic. Not all students who left public schools have returned since the pandemic abated. A structural shift in parents’ schooling preferences for their children, educational technology, and/or schools’ capacity to offer morning and afternoon childcare or extracurricular activities may be guiding decisions about the type of schools at which parents enroll their children. Fundamentally, shifts in preferences for public schools and related geographic and demographic heterogeneities continue to shift drivers of school enrollment. Additional data and research will be required to chart out those new relationships.
5 Tareena Musaddiq, Kevin Stange, Andrew Bacher-Hicks, Joshua Goodman.2022. “The Pandemic’s effect on demand for public schools, homeschooling, and private schools.” Journal of Public Economics, Volume 212.
6 Dee, T.S., Huffaker, E., Philips, C., & Sagara, E. (2021). The Revealed Preferences for School Reopening: Evidence from Public-School Disenrollment. CEPA Working Paper No. 21.06.
7 Peter Ciurczak and Matt Hieronimus, Public Statewide enrollment declines have leveled out two years into the pandemic, but in Boston declines continue., 2021. Statewide enrollment declines have leveled out two years into the pandemic, but in Boston declines continue. | Boston Indicators
8 Peter Ciurczak and Tyler Smith, Public School Enrollment Down Statewide and In Boston During the Pandemic, 2020. Public school enrollment down statewide and in Boston during pandemic. | Boston Indicators
Next Steps
This analysis looks at the direct relationship between housing unit development and school enrollment. Future research should explore additional data and mechanisms at-scale to fully understand the drivers of school enrollment through housing and demographic shifts. Avenues for future research include:
- Further explore existing research on the housing, demographic, and education components driving school enrollment.
- Build on analyses done at the municipal scale to understand the detailed drivers behind school enrollment change at the local level.
- Explore ways to expand this analysis to include multi-municipal district schools, such as identifying methods to allocate enrolled students to the municipalities in which they live.
- Incorporate information about unhoused students at the district level.
