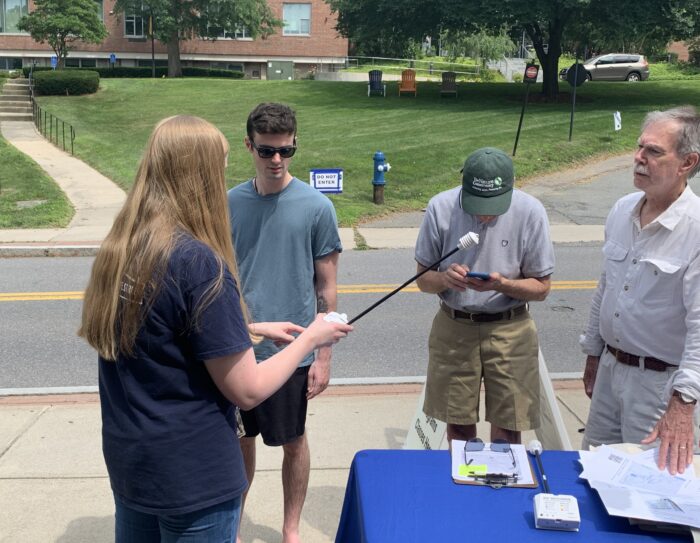
Earlier this month, 41 volunteers set out from Framingham State University (FSU) to collect temperature and humidity data along seven different routes, spanning 80 square miles. They conducted temperature data at three different times – a morning shift, afternoon shift, and an evening shift, to capture a comprehensive picture of the region’s temperature variations throughout the day on Thursday, July 13. The best time to conduct heat mapping is on both a hot and clear day, which was chosen a week ahead based on the weather forecast.
About the project
This effort was part of the MetroWest Heat Watch Campaign, a community science initiative led by FSU in collaboration with the City of Framingham, the Towns of Natick, Ashland, and Holliston, and the Metropolitan Area Planning Council (MAPC). Supported by the National Oceanic and Atmospheric Administration (NOAA) and the National Integrated Heat Health Information System (NIHHIS) Heat Watch Campaign, the project collects real-time data on heat and air quality in the MetroWest region during the summer of 2023. Several regions in Massachusetts have previously participated in the national program, including Metro Boston, Mystic River Watershed (see Wicked Hot Mystic), and Worcester.

The Value of Community Science
At the heart of community science, also sometimes called “citizen science” or “volunteer science,” is the commitment to increase access to science and engage the public through partnerships and collaborations. Volunteers and community members are encouraged to observe the world around them, identify challenges, and help find solutions.
By supporting community-led projects or co-creating projects, community science empowers and mobilizes communities, expands data collection and analysis, and provides valuable insights on complex scientific questions in both broader and local regions.[i]

Why heat mapping?
Amid increasingly hot summers in Massachusetts, heat mapping campaigns play a crucial role in revealing where urban heat is occurring and who is impacted the most. This information allows local government and non-profits to create effective strategies to reduce people’s exposure to extreme heat and prepare the region for the changing climate. Collecting real-time heat and humidity data also allows researchers, planners, and public health practitioners to better understand how people experience extreme heat in their day-to-day lives.
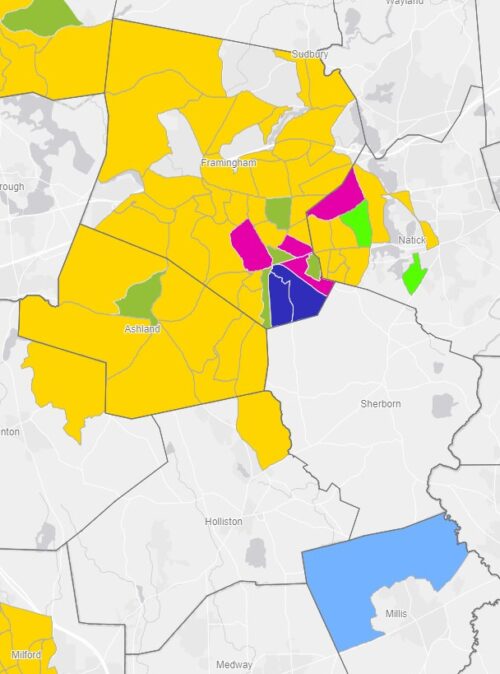
While everyone is susceptible to extreme heat, not everyone is impacted in the same way. The urban heat island (UHI) effect, in which areas with higher concentration of buildings and paved roads absorb and radiate the sun’s heat, are hotter than surrounding areas with more green spaces.[ii] Heat islands are inequitably distributed and disproportionately affect low-income and BIPOC (Black, Indigenous, and people of color) communities due in part to the history of redlining in many U.S. municipalities.[iii] Simultaneously, existing income inequality means that these communities face challenges in adapting to extreme heat, as they may have limited resources to purchase cooling devices and pay for energy utilities, retrofit their homes, or avoid outdoor work.[iv]
| Environmental Justice Populations in the Metro West Region | |||
| Municipality | EJ criteria[v] | Number of EJ block groups | Percent of population in EJ block groups |
| Ashland | MI | 9 | 100 |
| Framingham | MIE | 38 | 87.2 |
| Holliston | M | 1 | 7.8 |
| Natick | MIE | 11 | 36.6 |
Table source: EJ communities (Mass.gov).
There is increasing concern about the relationship between heat and health, especially considering the risk factors that arise from the intersection of heat islands and demographic inequities.[vi] Heat is the leading cause of weather-related death in the US[vii], and as the planet warms, we will face more heat waves and above 90°F days.[viii] While air quality is known to worsen due to an increase in ground-level ozone on hot, sunny days, respiratory conditions are also more common in some low-income households and communities of color. Additionally, extreme temperatures pose a significant risk to our infrastructure, transit systems, energy utilities, and economy.


What’s next?
NOAA partners CAPA Strategies will analyze the data and produce a series of models map that map the data collected by the MetroWest Heat Watch Campaign. The resulting map and reports will be used to help local and regional government develop targeted and equitable policy solutions to mitigate the impacts of urban heat, as well as inform the work of community-based organizations that are contributing to a more resilient region.
Additional resources and links
- About the Heat Mapping Campaigns
- Learn more about the 2023 Heat Watch Campaign, a community science initiative led by FSU’s McAuliffe Center.
- Wicked Hot Mystic campaign
- A 2021 heat mapping campaign in partnership with the Museum of Science, Boston, the Resilient Mystic River Collaborative (RMC), and the Mystic River Watershed Association (MyRWA).
- Wicked Hot Mystic Data Explorer
- An interactive map developed by MAPC based on the data collected from the Wicked Hot Mystic campaign.
- NIHHIS Urban Heat Island Mapping Campaign Cities
- Find out more about other cities that have done heat mapping campaigns and how your community can be involved in future campaigns.
- MAPC’s Resources on Extreme Heat
- A collection of resources around extreme heat, including heat-related projects and a social media toolkit.
Thank you to the organizers at Framingham State University (FSU), the City of Framingham, the Town of Natick, the Town of Ashland, the Town of Holliston, and the volunteers who have been a part of the initiative.
[i] Why Community Science? | Natural History Museum (nhm.org)
[ii] EPA Heat Island Effect Heat Island Effect | US EPA
[iii] Urban Heat Management and the Legacy of Redlining Full article: Urban Heat Management and the Legacy of Redlining (tandfonline.com)
[iv] EPA Heat Islands and Equity Heat Islands and Equity | US EPA
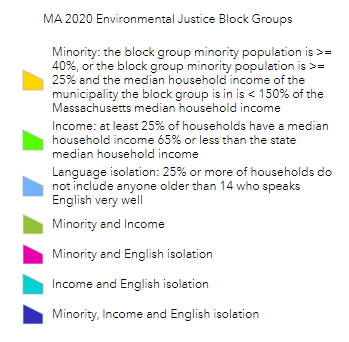
[v] In Massachusetts, an Environmental Justice Population is a neighborhood that meets any of the following criteria: minority (M), low-income (I), and speak English less than “very well” (E). (Mass.gov).
[vi] Heat Islands and Equity | US EPA
[vii] Weather Related Fatality and Injury Statistics
[viii] Boston has seen 24 days with temps 90 or above this year — and there’s still time for more – The Boston Globe
