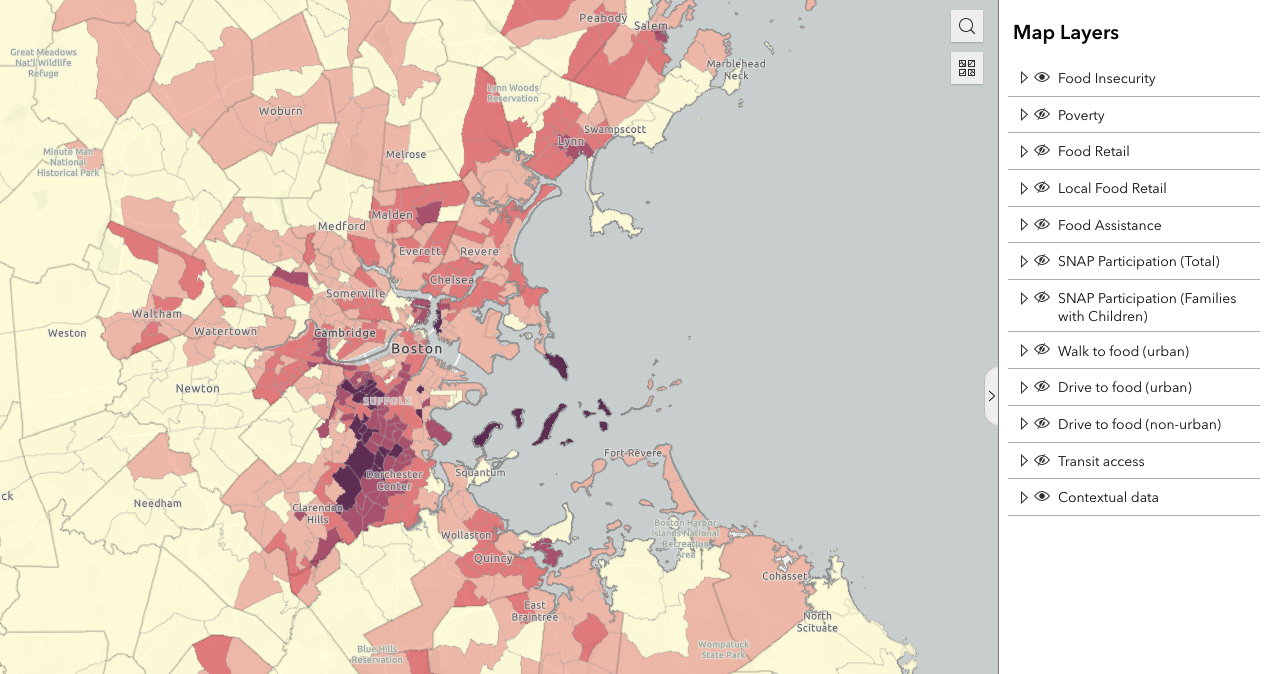
Are you wondering the extent to which food insecurity is experienced in your community? Or how easy or difficult it is to get nutritious food in different neighborhoods? Would you like to know if MBTA public transportation connects areas lacking nearby healthy and affordable food with food retailers? Are you conducting a Community Food Assessment or a Community Health Needs Assessment that includes information related to food access, food security, or related infrastructure? Find this information and much else in MAPC’s new Massachusetts Food Systems Map.
Developed with funding from the Massachusetts Department of Public Health Mass in Motion Program (MiM), the map compiles frequently-requested datasets for food and public health planning efforts in Massachusetts. Its interactive features allow users to select data of interest across customized geographies to facilitate community-level, spatial understandings of food access conditions across Massachusetts.
The map was created for MiM grantees who are improving community access to healthy and affordable food and opportunities for physical activity. However, it has much to offer for a wide range of food system and public health actors. At the civic level, it enables residents to become empowered with food system information related to their community. It allows planners, community organizations, food policy councils, and local governmental officials to better understand the local food system and strategically prioritize food access in their work. It provides information for grant writers, food system academics, and advocacy organizations to target research and services towards populations underserved by existing food access resources.
Data Available in the Massachusetts Food System Database Web Map
Category |
Indicators |
|---|---|
| Food Access Demographics |
|
| Food Access Score* |
|
| Food Assistance |
|
| Food Retail |
|
| MBTA Public Transit |
|
| Contextual Data |
|
* The layers “Walk to food (urban)”, “Drive to food (urban)”, and Drive to food (non-urban)” assign a score between 1-15 for the availability of a variety of nutritious foods at food stores within a reasonable distance. The range indicated low food access (0-6), moderate food access (6-12), and high food access (12-15). For details on this analysis, conducted by Tufts University, see the full report.
The map draws from the most current sources of data available to MAPC, ranging from 2010 to 2020 and, for the most part, representing conditions from before the onset of the COVID-19 pandemic. As new or updated datasets become available, MAPC will include these in the map.
Do you know of a dataset you think should be included in the MA Food System Database? Is something not working right? Reach out to Jessika Brenin at [email protected] to provide feedback and get help!
Attribution: When using this tool, please attribute the resource to MAPC including a list of the datasets, dates, and sources used.
For example:
Metropolitan Area Planning Council, Food System Map and Datasets, retrieved on [enter date you retrieved the data]. Datasets retrieved: [name of dataset], [source of dataset], [date of dataset].

