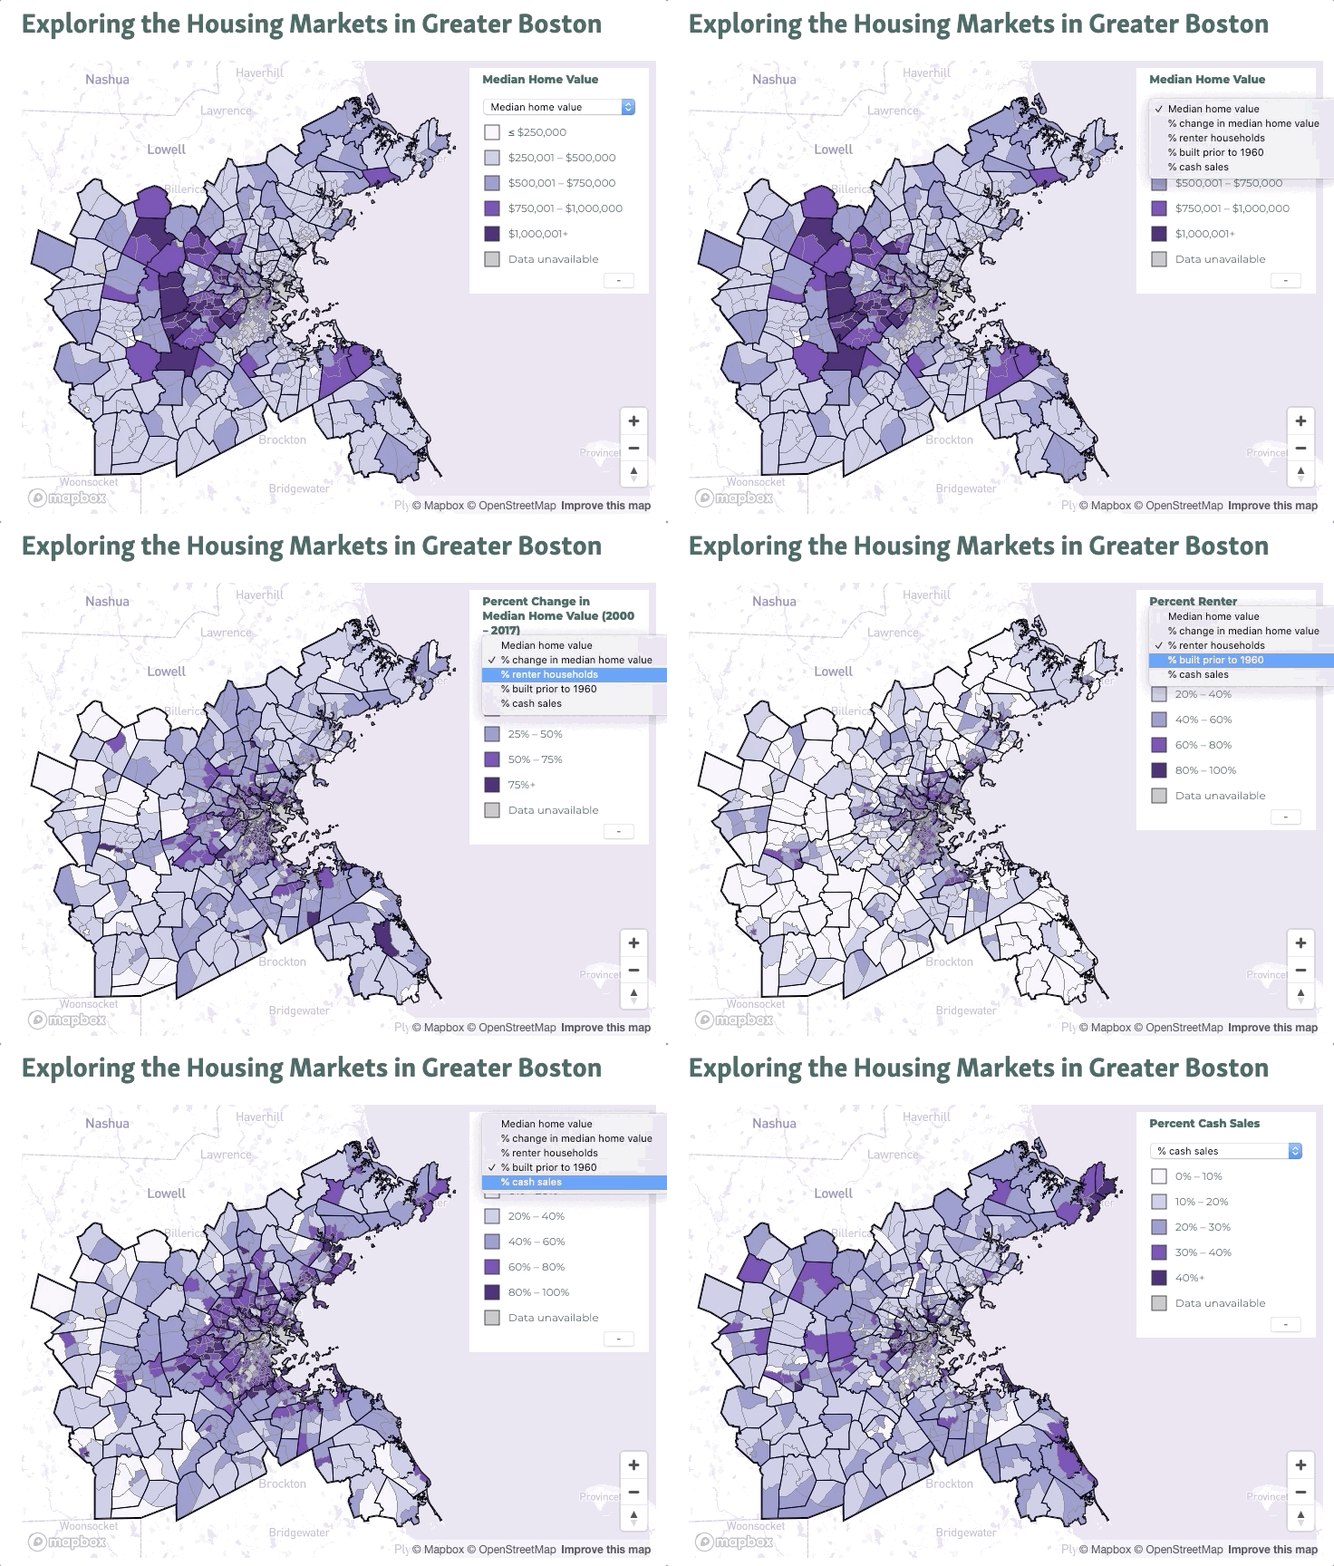
Every month, MAPC's Data Services department is releasing maps and data visualizations covering a range of vital and interrelated topics: equity, housing, transportation, climate, arts and culture, and more.
February’s visualization provides a sneak peek into MAPC's upcoming research release on housing submarkets. Our region is not made of one housing market, but many, and a range of housing policies are needed to best serve them.
Click here to view the interactive version of the map above.
Greater Boston is not one housing market, but many – and the factors that distinguish them don't follow lines on a map. In a single municipality, there can be wild differences from block to block. There are neighborhoods more akin to other parts of the region than to the next streets over.
Some areas, for example in the inner core, are characterized by high density and increasing home prices. Others, often suburban, have mostly older housing stock and residents with incomes high enough to affect supply and demand. The defining variables may – but don't always – vary directly.
A one-size-fits-all housing policy can't serve the region's needs – they're too heterogeneous. But so are the needs of any municipality. Instead, policies should be tailored to housing submarkets: areas, wherever they are, with similar characteristics.
MAPC examined 28 indicators and how they combine across 2010 Census tracts. We drew from this seven submarkets, as will be detailed in a report and interactive map to be released this month. The accompanying map charts five of the variables we used:
- Median home value
- Percent change in median home value (from 2000 to 2017)
- Percentage of renter households
- Percent of home stock built before 1960
- Percent of homes bought with cash
These maps do not directly display the submarkets, but they do reveal patterns in the ways even these few indicators combine. For example, tracts in the southwest and near the north shore tend to have median home values under $250,000 and a low percentage of renters. Downtown Boston has, as a whole, experienced a surge in median home values, but the percentage of houses built before 1960 varies from tract to tract.
Be among the first to dive into housing submarkets and submarket-specific policy at our February 23 webinar. We hope to see you there!

