Greater Boston Residents of Color More Likely to Live Near High-Polluting Roads
Linked to increased COVID-19 risk
Greater Boston residents of color are more likely to live close to high-polluting roadways, demonstrates a new study released by MAPC today.
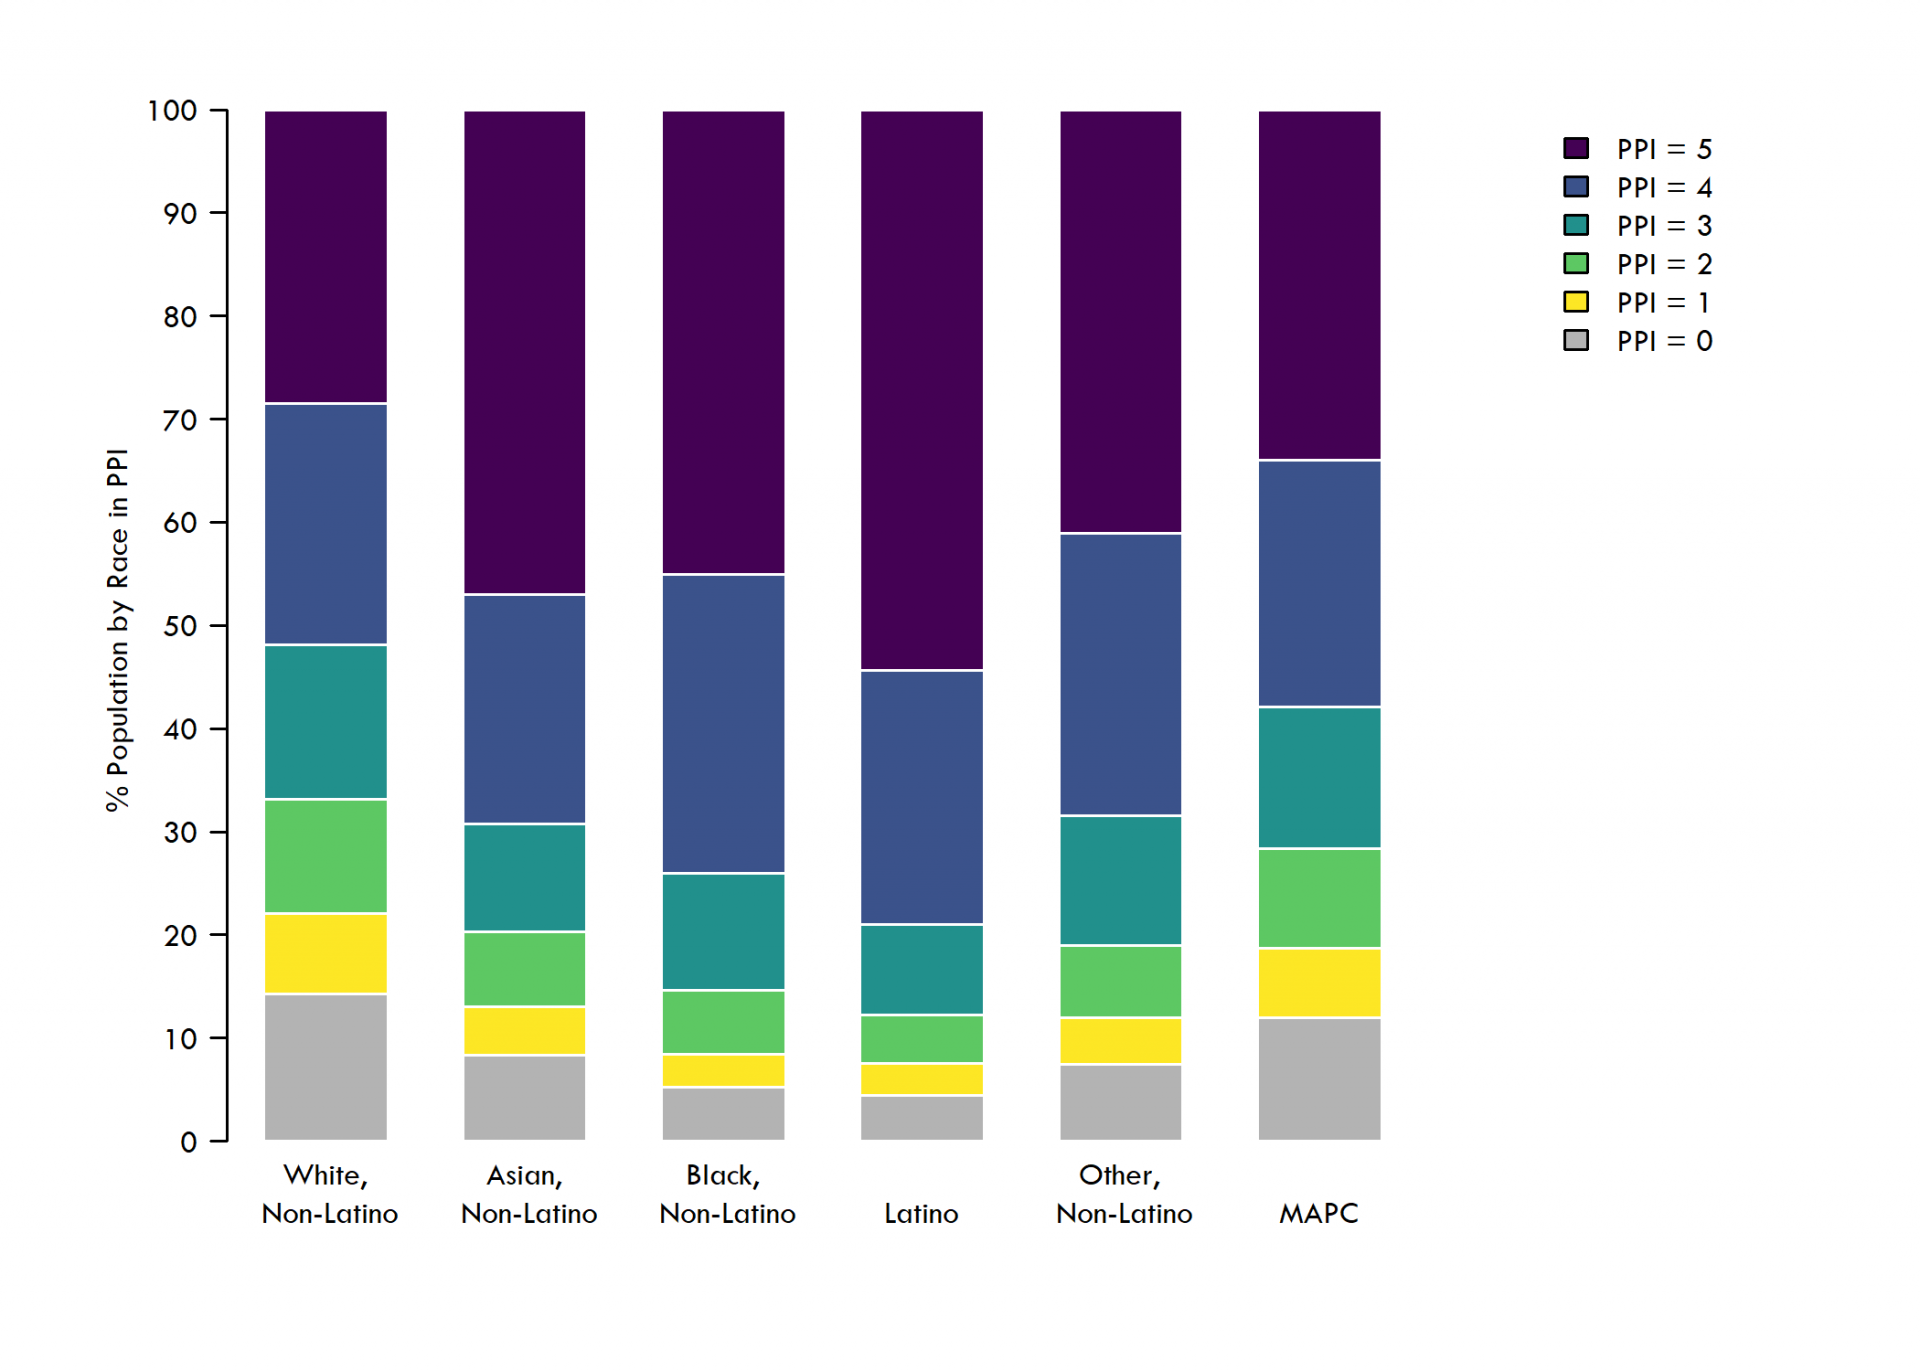
Forty-five percent of the region’s Black residents, 47 percent of the region’s Asian residents, and 54 percent of the region’s Latino residents live in the highest-pollution areas, compared to only 29 percent of the region’s white residents. Exposure to vehicle air pollution increases the risk of heart and lung diseases, which have been associated with higher death rates for patients suffering from COVID-19.
MAPC’s study looked at the volume, speed, and fleet mix of traffic on a given roadway, distance residents live to that roadway, and proximity to other high-emitting roadways nearby to determine the emissions intensity of different areas. Based on these metrics, the study assigns a Pollution Proximity Index (PPI) score ranging from 1 to 5 to different areas, with 5 representing the areas in the region with the highest 20 percent of emissions intensity values.
MAPC residents in each Pollution Proximity Index group, by race

MAPC’s analysis shows that 88 percent of residents in the region live within 150 meters of a major road and 34 percent live in the areas with high levels of vehicle pollution (the top fifth of emissions intensity values).
Exposure to air pollution from vehicle tailpipes increases risk of heart and lung diseases. Having these diseases, in turn, increases the risk of death for COVID-19 patients. Previous studies have shown that pollution levels are often highest right next to busy roadways. Some types of vehicles and traffic patterns give off higher emissions, as well—a road with frequent stop-and-start, slow moving traffic or one frequented by diesel trucks will see higher levels of emissions, for example.
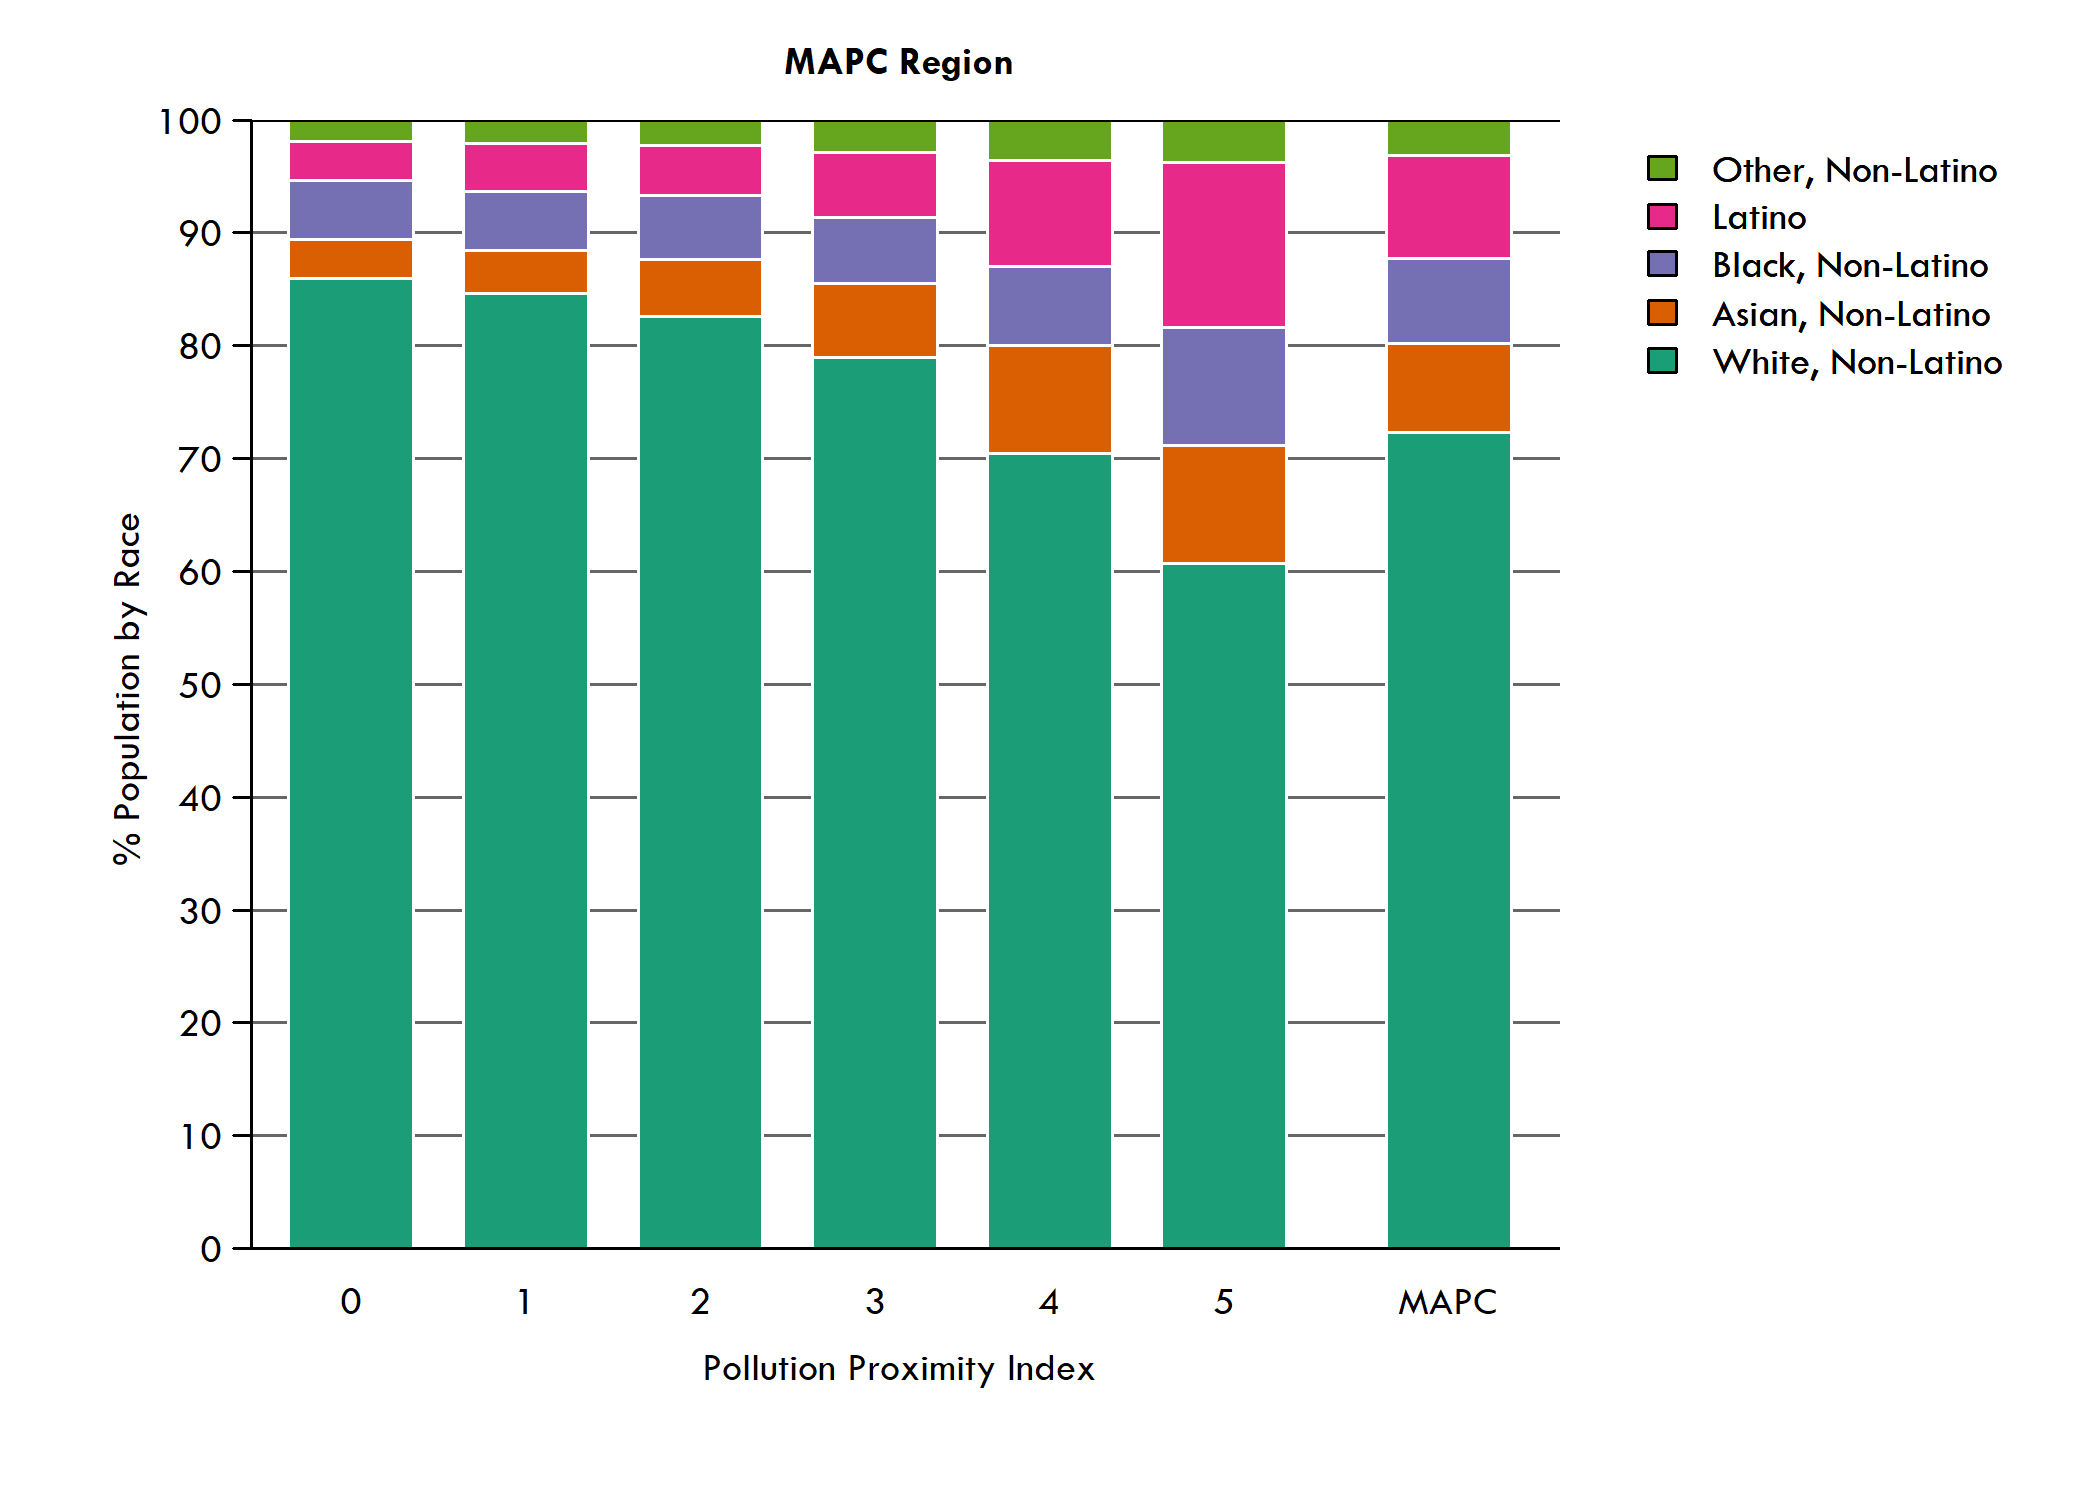
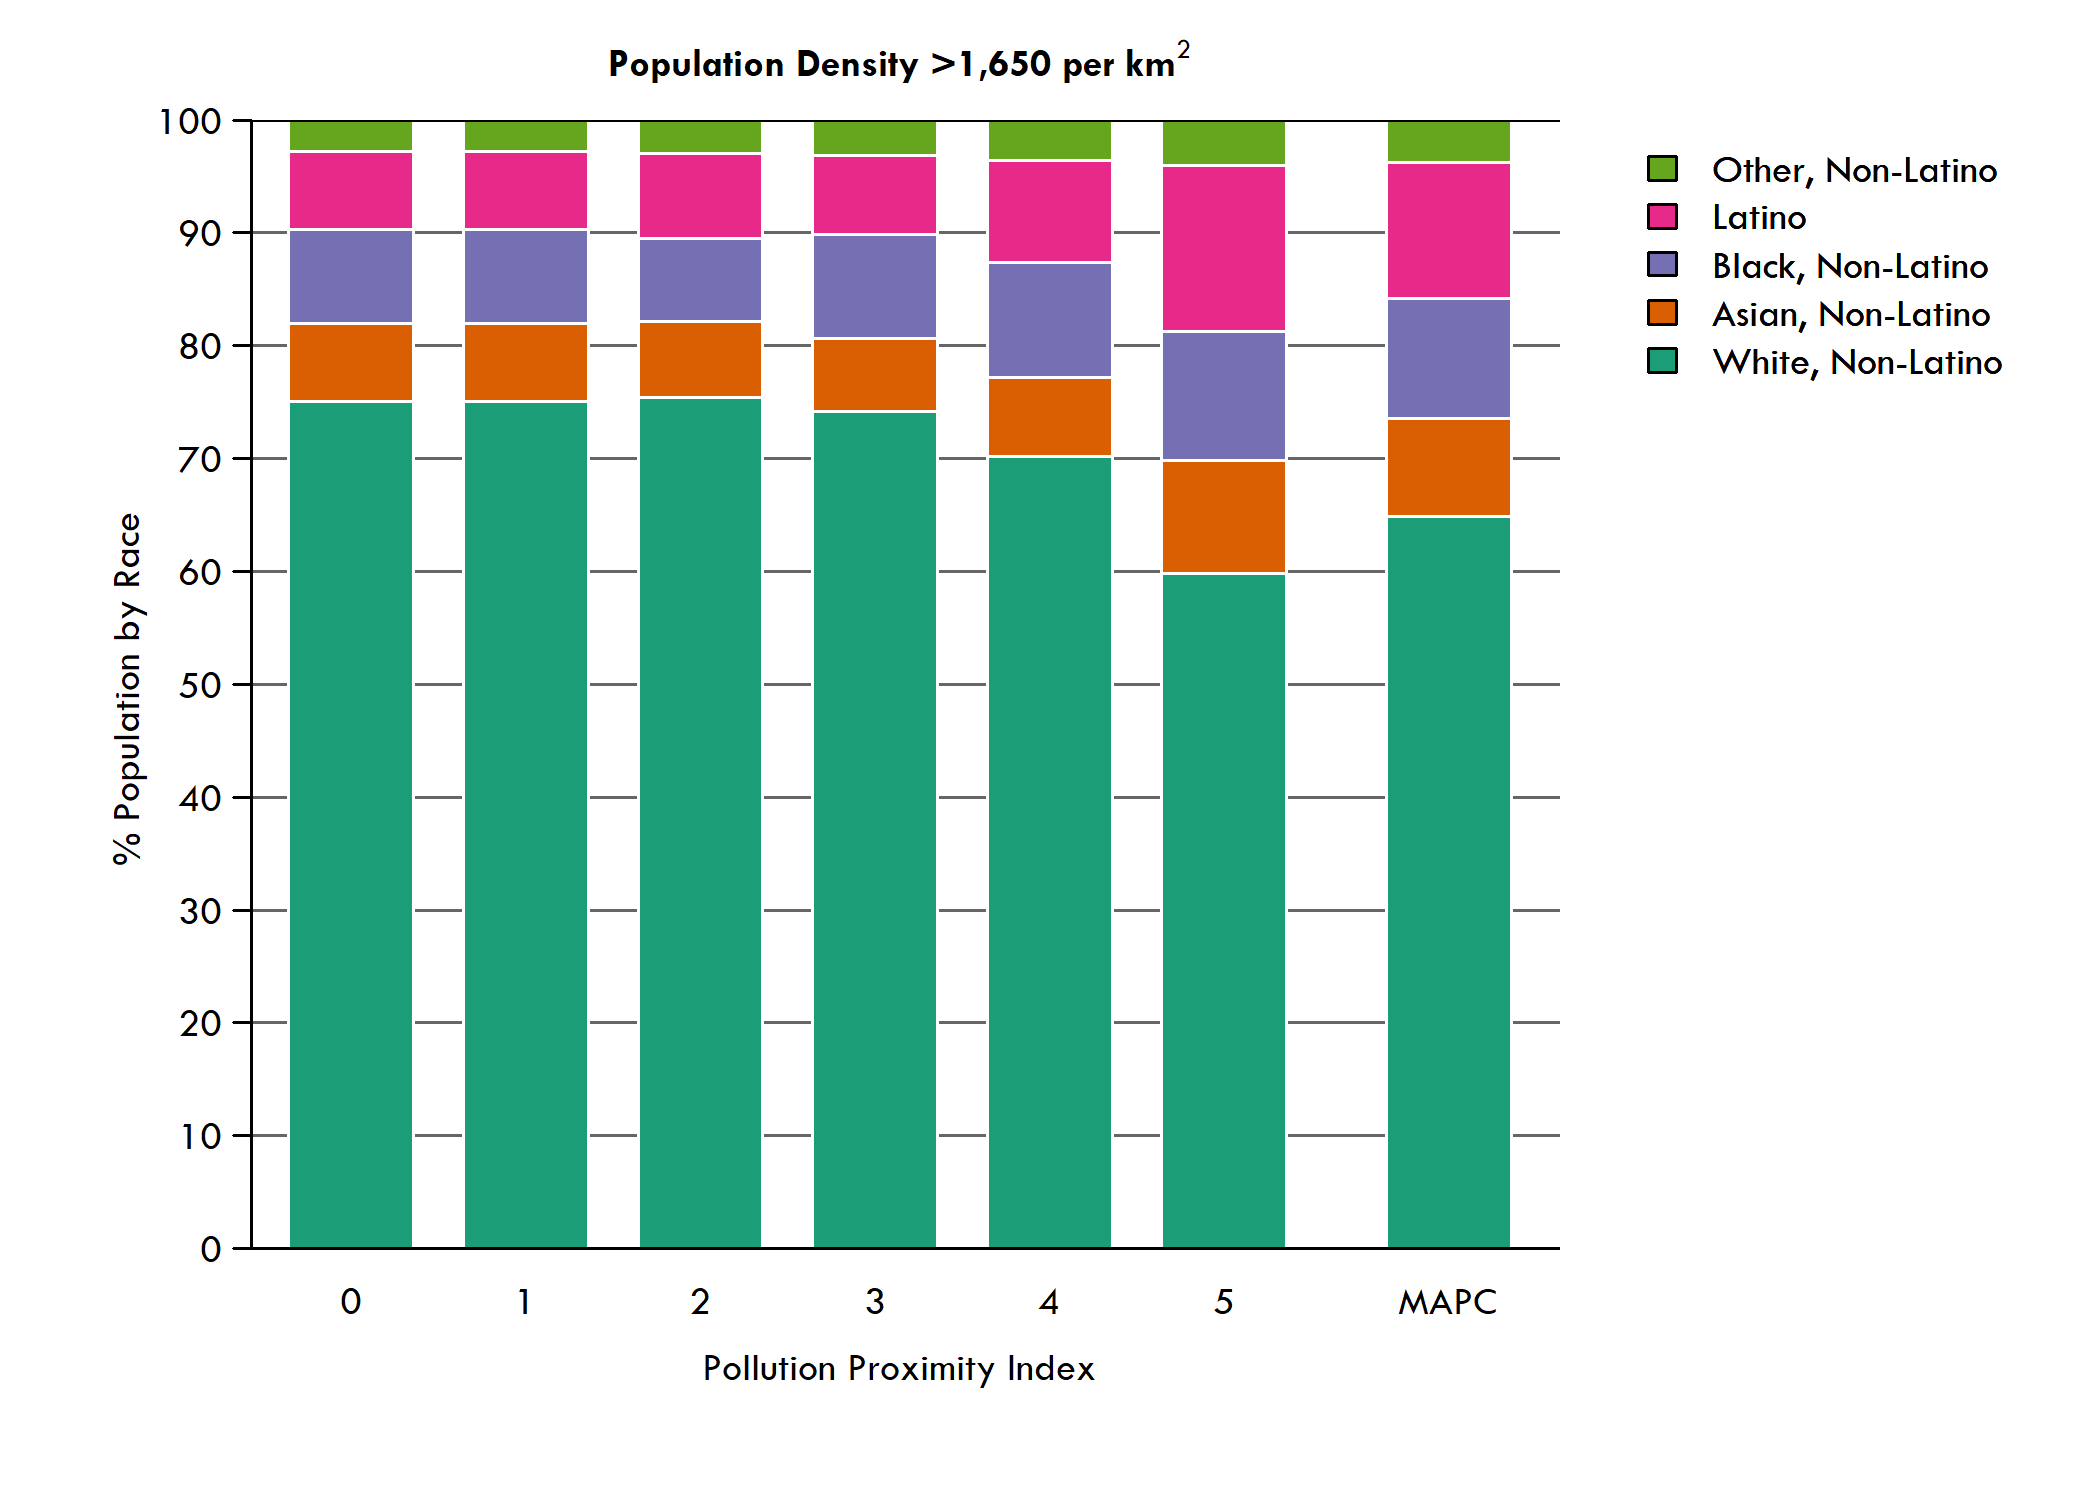
But high pollution doesn’t affect all groups equally: this analysis lays out the stark difference in exposure for white Greater Boston residents and those of color. Black, Asian, and Latino residents are over represented in the top emissions intensity group, with Latino residents seeing the biggest disparity between their share of the regional population and their share of people living in areas with the highest emissions. These inequities are not just because more people of color live in denser urban areas. There are differences in pollution intensity even within the most urbanized areas of the region. When MAPC only analyzed areas with high population density, people of color remain over represented in the most polluted locations.
Distribution of population in each of the PPI categories by race and ethnicity

Highest-density areas: distribution of population in each of the PPI categories by race and ethnicity

The overlapping spatial patterns of pollution and residents of color is not merely a quirk of geography. These patterns reflect the historical impacts of inequitable zoning and redlining, choices of locations for affordable housing development, and the siting of urban freeways and expressways, which were often designed to cut through minority neighborhoods. The disparities in pollution exposure mirror the disparities the state is experiencing with COVID-19 cases: within the urban core, it is communities like Chelsea with larger minority populations that are seeing some of the state’s highest rates of COVID-19 cases.
We can make changes at both small-scale and systemic levels to protect our residents exposed to air pollution by:
- Modifying individual buildings to keep polluted air out. Strategies include moving air intakes for ventilation systems to places protected from road emissions and tightening the building envelope through additional insulation, soundproofing retrofits, and air filtration systems.
- Ensuring new buildings built near high pollution roads have filters with a Minimum Efficiency Reporting Value (MERV) of 13 or greater and have plans for long-term maintenance.
- Expanding access to affordable housing in areas that are at a safer distance from existing high pollution roads
- Empowering communities of color to have influence on the construction or expansion of new roads in their neighborhoods
- Improving urban design by installing highway sound barriers, orienting buildings to improve airflow and allow pollution to disperse quickly, and siting parks, playgrounds, schools, and new residential development away from high-emissions roads.
- Implementing traffic management solutions like reducing local truck traffic and improving traffic flow at intersections.
- Taking steps toward broad, systemic change to reduce emissions’ root cause: a fossil-fuel powered, largely single-occupant vehicle fleet. We can reduce our greenhouse gas emissions by encouraging people to take alternate, cleaner means of transportation; improving our public transit, pedestrian, and bicycle infrastructure; shifting to electrification; and participating in regional policy initiatives like the Transportation Climate Initiative, a 12-state collaboration aimed at reducing transportation-related emissions.
As the Commonwealth begins to recover from the pandemic, it is important we recognize the inequities that this crisis has made deeply evident. Addressing disparate impacts should be at the forefront of an equitable economic recovery. Targeted investments in clean transportation solutions is not only an effective job creation mechanism, but can also help confront some of the unequal public health outcomes this analysis has highlighted.
Read the full report and technical appendix here.
Questions? Reach out to Conor Gately at [email protected].
