Every month, MAPC's Data Services department is releasing maps and data visualizations covering a range of vital and interrelated topics: equity, housing, transportation, climate, arts and culture, and more.
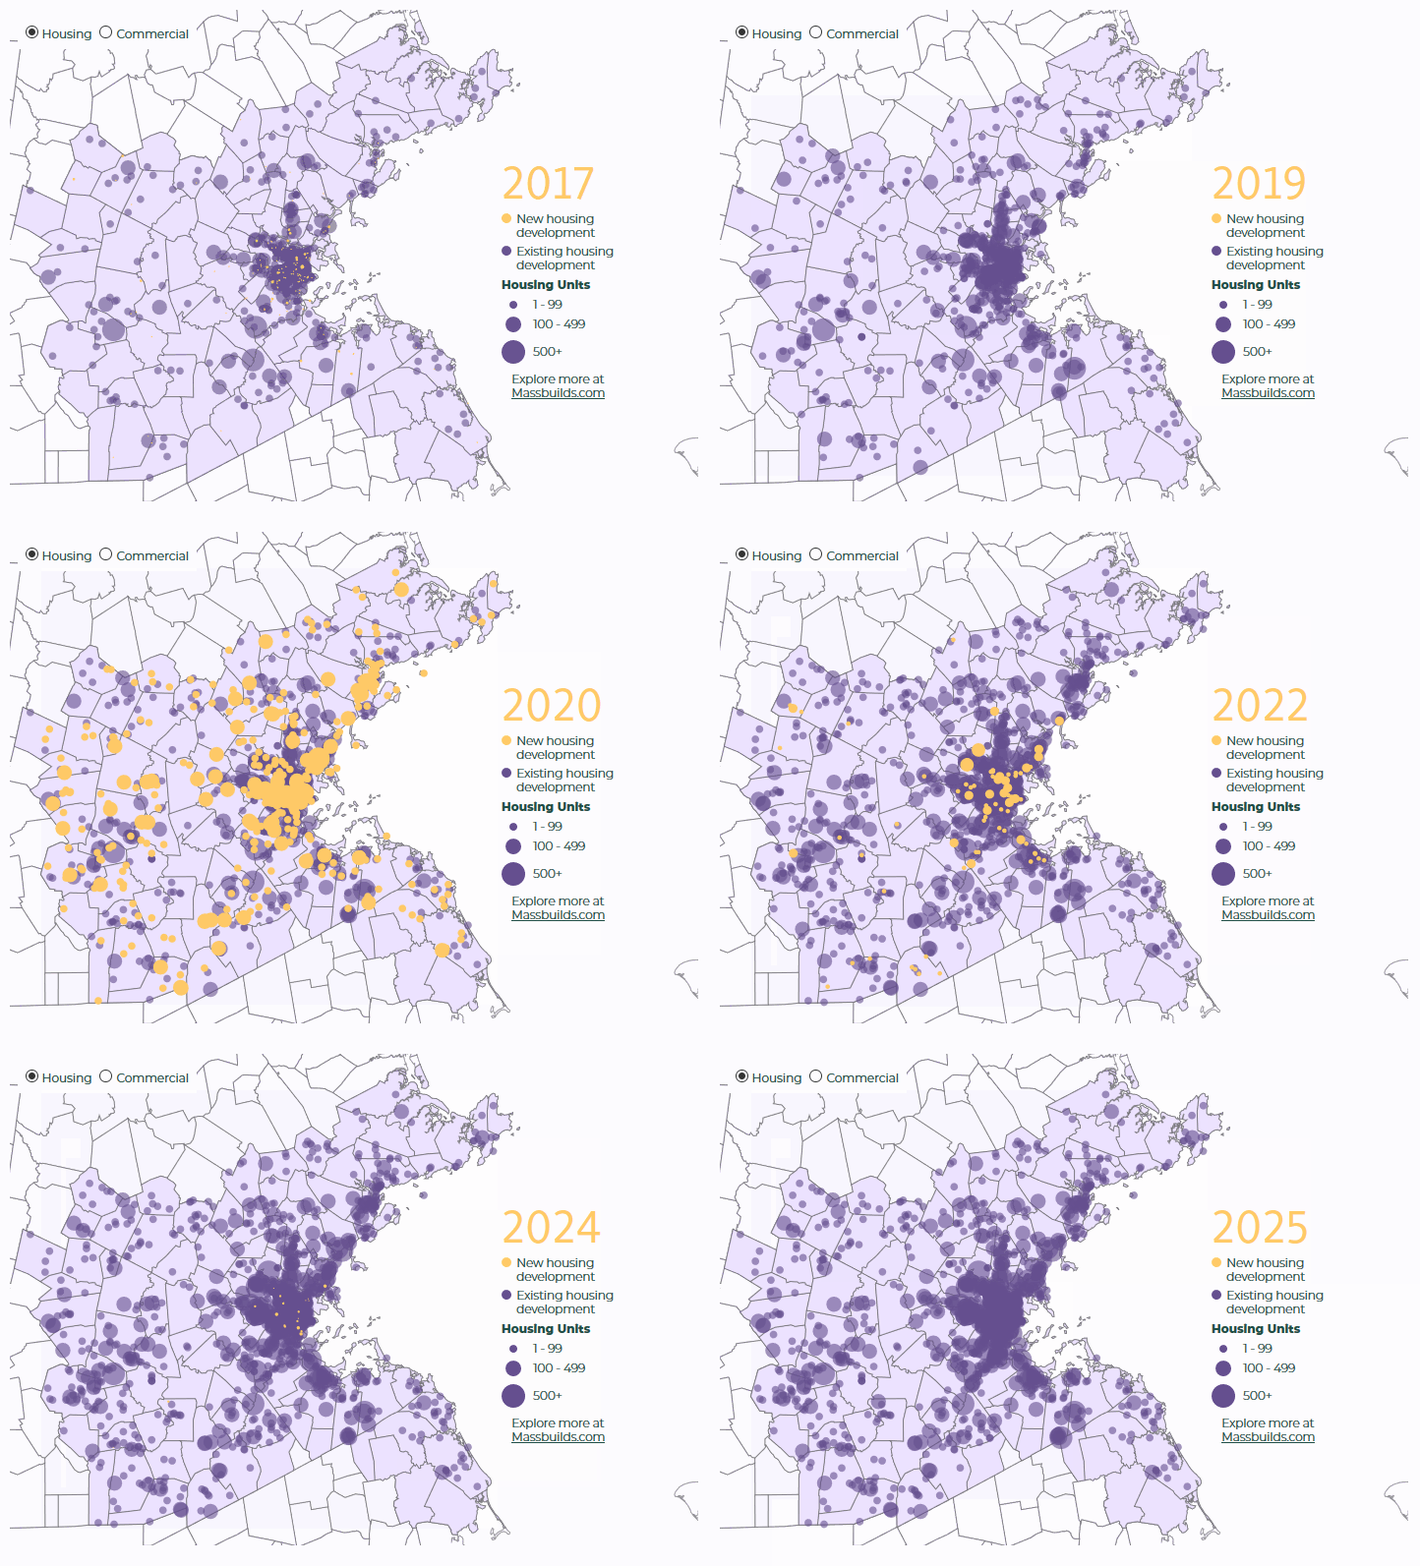
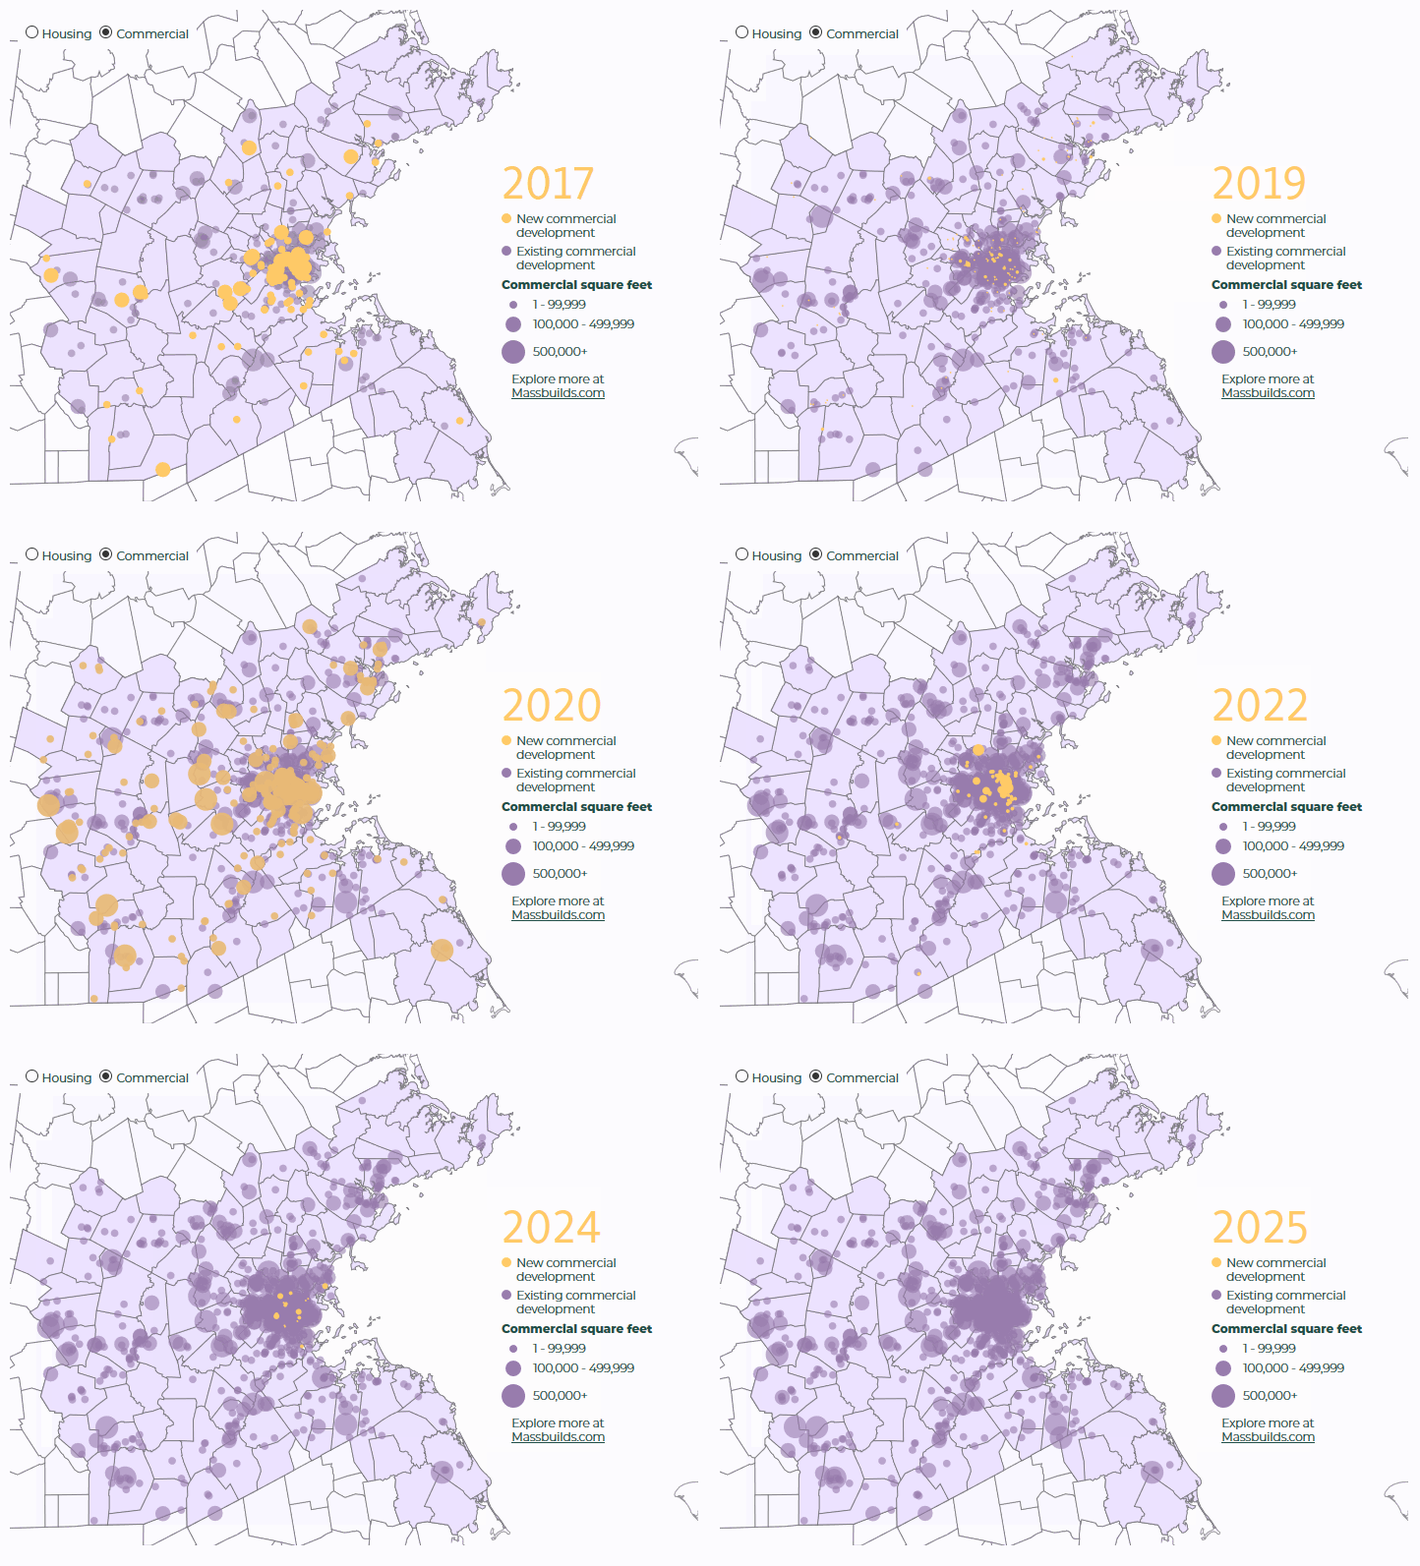
March’s visualization looks at development across the region from 2015 through 2025. Using data from MAPC's own MassBuilds, this visualization explores where development has happened, is happening, and will happen in the next few years.
Anyone living or working in Metro Boston is no stranger to the sights and sounds of construction happening around them. But while it's easy to identify the changes happening around your home or office, it's harder to see the big picture. Is that new medical office or apartment building a rarity, or part of a larger trend?
MAPC's MassBuilds database can help identify the regional picture: where development is happening, what types of buildings are under permitted or under construction, and what characteristics those buildings share.
MassBuilds is a collaborative data inventory that provides a picture of the region’s growth through a website that allows users to view, download, and contribute information about thousands of development projects recently completed or in the pipeline. This map of MassBuilds data shows projects completed since 2015 as well as those in or nearing construction in the next five years.
Together, this group totals 128,374 housing units and 100.86 million square feet of commercial development.
1,310 developments in the Inner Core account for 72% of the housing and 70% of the commercial square footage, with the balance distributed across 864 developments elsewhere in the region.
Office and medical space has dominated the majority of commercial square footage development, accounting for 35% percent of all tracked development from 2015 to 2020.
MassBuilds also shows a move towards transit-oriented development: 65% of all housing units and commercial square footage from 2015-2025 are within ½ mile of a commuter rail or rapid transit station. This may help explain the low residential parking rates. For residential projects with information about parking, we see an average of 0.68 spaces per unit for developments completed 2015-2019 and compared to 0.60 spaces per unit projected for developments with a completion date of 2020-2025.
Tracking and anticipating development across Metro Boston is challenging. Each municipality has its own planning office and building inspector, and information about development is often scattered across multiple websites or sitting in spreadsheets across the region.
Data like this helps shape our region and is available because MassBuilds collects it across geographic boundaries.
MassBuilds gives municipalities and state agencies a fuller picture of development trends in real time as they regulate and invest in sustainable and equitable development. However, this system is just the beginning of a broader vision. Without a regional system for development applications or building permits, housing and job growth is usually measured after the fact with disparate data sources that often lack detailed information. One day we hope to move to a more integrated regional system that encourages the collection of this data within the development process: projects could be tagged when a construction or occupancy permit is awarded, site plans could automatically track information about parking and affordability, and projects of all sizes could be automatically tracked across the region. Learn more about MassBuilds and contribute data by creating a free account at www.MassBuilds.com today.
Interested in seeing more data visualizations about the MAPC region? Check out our DataCommon gallery to see new content monthly!


