
The MAPC Public Health team is excited to announce updates to the Massachusetts Food Systems Map!
Communities today are more aware of the importance of food access than ever before. But are they aware of where food insecure residents are served by food pantries? Or which grocery stores are inaccessible by transit? Or the climate risks present in Environmental Justice neighborhoods? The MA Food Systems Map can now answer these questions and paint a more comprehensive, nuanced picture of the food landscape in our region.
The Food Systems Map was created in 2022 with funding from the Massachusetts Department of Public Health Mass in Motion Program (MiM). The map compiles frequently requested datasets for food and public health planning efforts in Massachusetts. Its interactive features allow users to select data of interest across geographies to facilitate community-level, spatial understandings of food access conditions across Massachusetts. 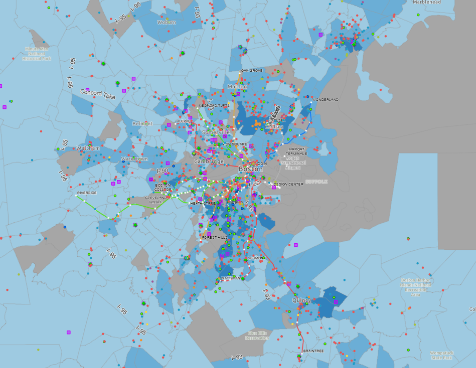
Through the technical support of MAPC’s Data Services team, we have improved user experience and added new data layers to allow for a more comprehensive exploration of the Commonwealth’s food access landscape. These updates and improvements were developed based on feedback collected through individual user testing and focus group engagements with food system practitioners from across the state, many involved in MiM communities. Participants reported primarily using this tool to understand local food system context and identify assets and gaps in their communities. We prioritized updates that enhance these use cases and allow for a deeper ability to support food system planning while connecting to other useful resources geared towards individuals searching for food pantries or farms.
WHAT’S NEW?
We made multiple improvements to the user experience side, including:
- Pop up greeting – directs people to other sites who may be looking for food pantries or farms and Community Supported Agriculture (CSA) programs
- Instructions – updated and available on right hand side of the screen where they can be viewed while using the map
- Check boxes replaced eye icons for clearer indication of layers being displayed
- Added road labels
On the data side, we’ve both refreshed older data layers and added more to explore. Updates include:
- Added new geographic boundary layers so in addition to municipal and census tract boundaries, users can now see the map divided by zip codes, wards, and house or senate districts.
- Food retailer points from Data Axle updated to 2025
- New climate and environment data layers
- Environmental Justice (EJ) Census blocks, with criteria (2020)
- FEMA national flood hazard areas (2025)
- Land Surface Temperature Index Hot Spots (2018-2020)
- Sea level rise, measured by MA Coast Flood Risk Model from Woods Hold Group
- Additional SNAP information added, with data from the MA Department of Transition Assistance.
- Monthly caseloads by municipality – from March 2026, DTA, to be updated quarterly
- Monthly caseloads by zip code – from March 2026, DTA, to be updated quarterly
Two layers were removed: The Food Access Index data layers, “Walk to Food” and “Drive to Food”, developed in partnership with Tufts graduate students in 2016. Given how outdated the data was and that MAPC is unable to update these layers, we decided to remove them from the map. These layers are available to share upon request.
We hope you’ll take a look and let us know how we can continue to improve this tool to better serve food systems planning and connect our Commonwealth food systems. Reach out to Rachel Weil with suggestions for improvements or additions at [email protected].