As public schools let out this week in Greater Boston, summer fun is on people’s minds and many are planning their vacations, barbeques, and other summer activities. While the warmer weather is welcomed by many, it also signals the start of extreme heat season - which can be a public health hazard, especially for the elderly, children, and outdoor workers. It can also put added strain on our electrical grid as more people turn on their air conditioning.
Extreme heat is exacerbated in urban areas by urban heat island (UHI) effect. On hot days, the concrete sidewalks, streets, and buildings absorb heat from the sun and radiate it back into the air. Heat trapped during the day is re-emitted at night. This means that urban areas are much hotter during the day than surrounding suburban areas and don’t get a chance to cool back down at night.
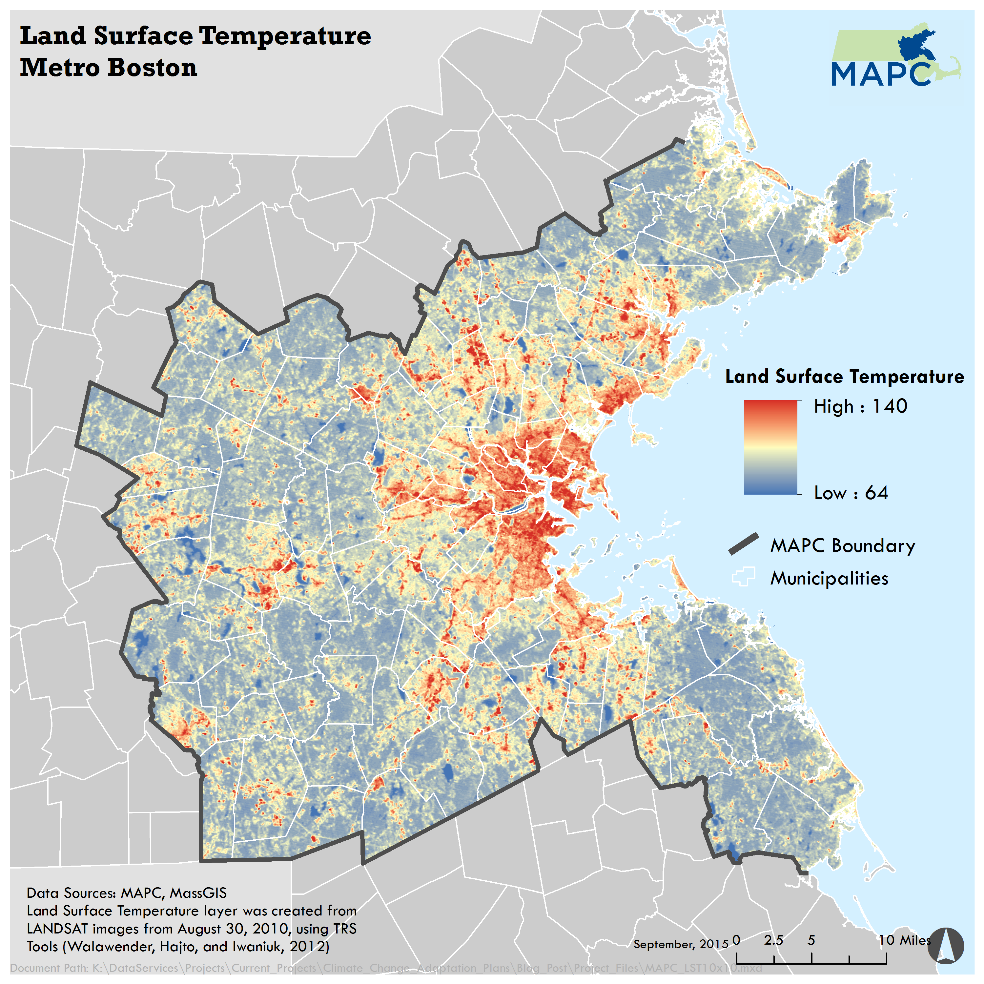
MAPC has mapped the impacts of urban heat island effect across the Greater Boston region using satellite data.

This map shows a clear differences between urban and suburban communities, as well as between places with green space and street trees and those without any greenery. Communities throughout our region are using this information to plan for climate change and identify areas for green infrastructure and street trees. However, the data is limited in what it can tell us and more granularity is needed to plan for and mitigate the impacts of urban heat islands in our communities.
This is just one reason why the City of Boston, City of Cambridge, and Town of Brookline are partnering with the Museum of Science, SciStarter, Arizona State University, Northeastern University, and the National Informal Science Education Network on a project called Citizen Science, Civics, and Resilient Communities (CSCRC). This National Oceanic and Atmospheric Administration (NOAA)-funded partnership seeks to engage public participants in citizen science and resilience. The project aims to connect citizen science data to four weather and climate-related resilience issues - extreme heat, extreme precipitation, drought, and sea level rise - at 28 science centers around the US over the next three years. Participants from around the nation will collect data and discuss strategies that communities can take to become more prepared and resilient to these climate issues.
What is citizen science?
Citizen science is often a collaboration between trained scientists and volunteers to conduct scientific research. Volunteers are often non-professionals that participate in data collection and analysis. Citizen science helps expand data collection and research and increases public understanding and connection to a research project.
This summer, Boston, Cambridge, and Brookline are focusing on extreme heat.
By engaging in heat-related citizen science projects, they hope to immerse the public in learning about this important issue and build a greater understanding of how heat affects some areas more than others. There are two phases of the project: 1) Using the online platform, ISeeChange, participants can document environmental changes happening in their neighborhoods. 2) The municipalities will work with volunteers to collect temperature data from around the three communities.

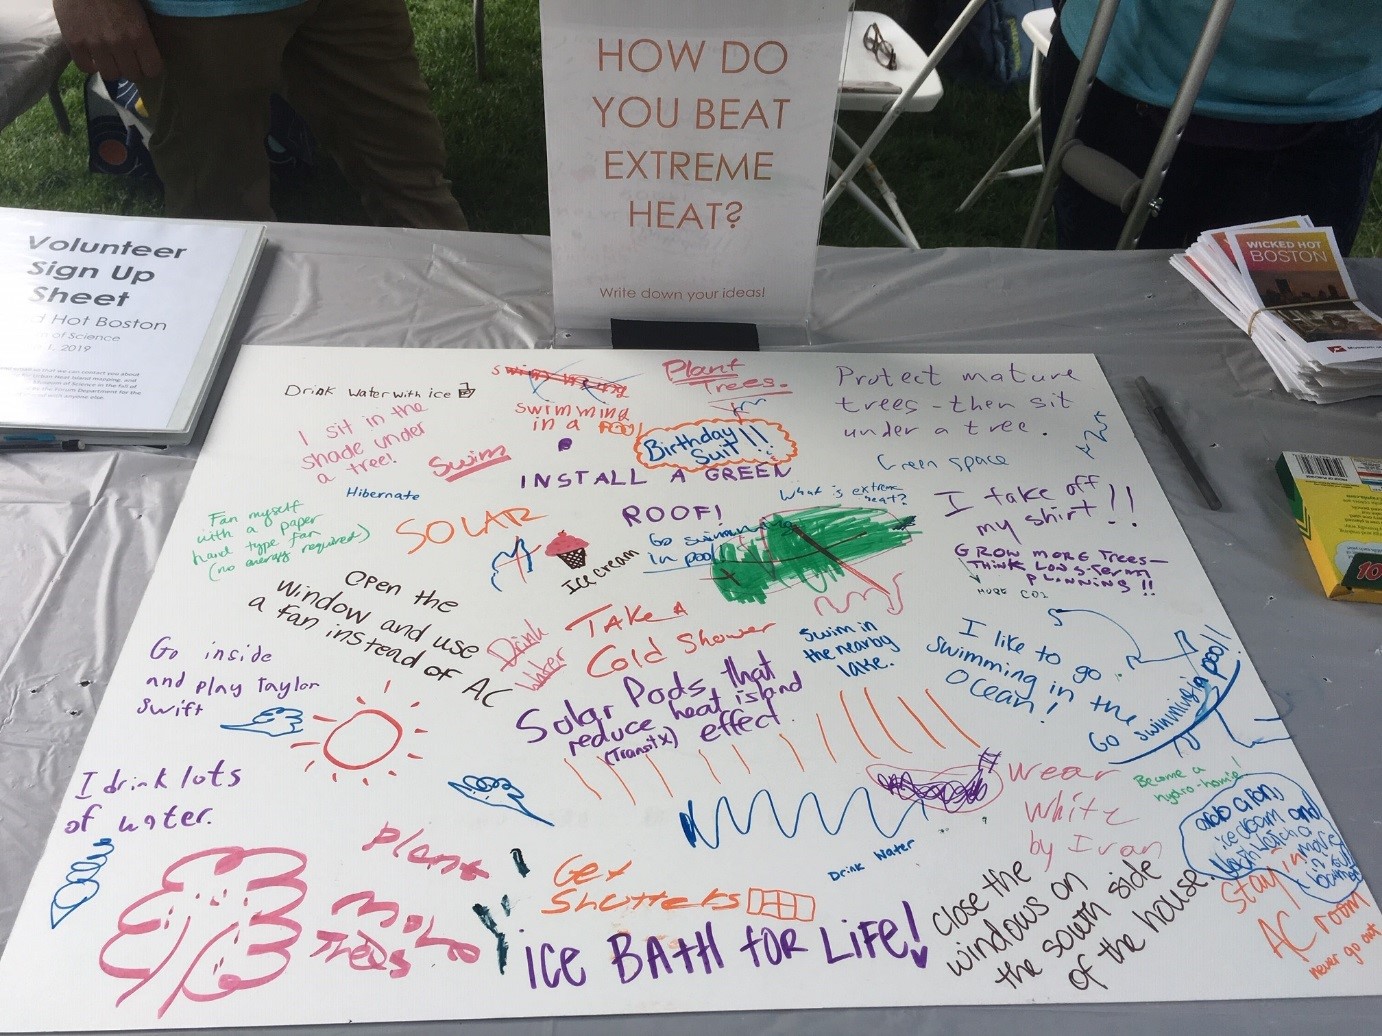
Wicked Hot Boston launched earlier this month at Cambridge Arts River Festival, where participants were asked "How do you beat extreme heat?" Source: Museum of Science, Boston.
If you’re interested in participating in this citizen science program, head over to the Museum of Science’s SciStarter Page where you can track climate data in your neighborhood, connect with others through the platform, and sign up to volunteer with the urban heat island mapping project.
Questions about the program? Contact: [email protected]
