Top

Addressing the Digital Divide in Revere and Chelsea

Digital Access and Equity Plan
for the Cities of Revere and Chelsea

Addressing the Digital Divide in Revere and Chelsea

This page is no longer being updated. To download the Chelsea, Everett, and Revere Digital Equity Plan, see here. Information about the Chelsea Digital Equity charrette and plan update can be found here. For more information about MAPC’s digital equity work, visit our Digital Equity Program page.

Revere and Chelsea

Few Massachusetts municipalities of Revere and Chelsea’s size and demographics have adopted a clear strategy around ensuring the accessibility and availability of fast, reliable, and affordable internet to residents and businesses, and most cities and towns within the state do not have a clear understanding of the role of local government in the area of digital access. Revere and Chelsea are set to become leaders within the Commonwealth by developing a plan that is scaled to fit the capacity of municipal staff while leveraging a strong resource network of local, state, and federal resources that cross the public, private, educational, and nonprofit sectors.

With funding through a Federal Economic Development Administration Disaster Mitigation and Recovery Grant, MAPC will build the capacity of City stakeholders to begin addressing the challenges of internet access in Revere and Chelsea. The project will be guided by a Core Working Group made up of City staff and key partners, as well as an Advisory Committee of expert entities. The timeframe for this project will be six months, from March to August 2021.

DIGITAL ACCESS AND EQUITY SURVEY NOW AVAILABLE!

Your input will help the cities plan for future investment, policy changes, and program development to improve internet access and bridge the digital divide. We encourage you to share this survey with your family and friends. All information will be held confidential and only shared in aggregate form. If you would be interested in participating in a follow up conversation or focus group please indicate where asked at the end of this survey.
(Flyer Revere) (Flyer Chelsea)


Questions?

Contact Josh Eichen, MAPC Senior Economic Development Planner.

The development of the plan will hinge on three determining factors

Access to Affordable, High Speed, and Reliable Internet

Ensuring that residents and businesses can acquire internet services at an affordable price, regardless of the neighborhood they reside in or the demographics of population, which meets their needs. This will be a central focus of the Plan. MAPC will work to evaluate the existing range of internet service providers and associated service availability, costs, and speeds. Based on this analysis, MAPC will work with the Cities to evaluate a suite of options that would improve the access to affordable, high speed, and reliable internet in the City.

Availability of Computing Devices

In order to utilize the internet for critical personal services such as education, healthcare, and job search/online applications individuals need a computing device with a certain speed and functionality. The proliferation of smartphone technology has helped millions of individuals gain access to the communications benefits of the internet, but is not a substitute for a personal computing devices function. MAPC will work to evaluate the computing gap in Revere and Chelsea, and steps to improve device availability for the community.

Digital Literacy

The ability to use a device and internet effectively and in a way that enables an individual to easily navigate needed uses and services is the last determining factor that MAPC will structure this plan around. Understanding the different uses and needs of various segments of the two cities will assist in creating a plan for improving literacy in a way that meets community needs and culture.

Plan Development

The Plan will outline the different paths available to improve internet access within the region, accompanied by approximate costs, estimated timelines, and proposed partnerships. The plan’s recommendations will be structured around achieving the to-be-determined vision and goal of internet access and will lay out 2-3 potential pathways that Chelsea and Revere and community stakeholders could pursue.

These pathways may include actions that could be taken by the Cities’ administration, school district, community-based organizations, internet service providers, or other entities. The pathways will not be mutually exclusive, and MAPC will work with the Cities’ administration and stakeholders to evaluate short, medium, and long term opportunities.

MAPC will work to align this process with regional and state-level efforts to advance broader internet access. Where possible, MAPC will coordinate the recommendations and implementation steps with efforts in adjacent communities to encourage shared resources and investment strategies.

This plan will include several deliverables: 

A Core Working Committee will be formed with the assistance of the Revere Deputy Director of Planning and Economic Development and the Chelsea Economic Development Planner. The Core Working Committee will consist of stakeholders from:

  • School administrators and student representatives from the Revere and Chelsea School District
  • Representatives of the Revere and Chelsea Housing Authority and tenant representatives
  • Revere Workforce, Housing, and Business Stability Officers
  • Representatives of the Revere and Chelsea Public Library system
  • Revere’s and Chelsea’s Chief Information Officer
  • Representative(s) from Revere and Chelsea City Council, School Committee
  • Community-Based Organizations (CBO’s) such as The Neighborhood Developers, MACIR, WEE, La Colaborativa, GreenRoots, and the Revere and Chelsea Community Schools.
  • Anchor services providers such as North Suffolk Mental Health Center, MGH, BIDMC, Cambridge Health Alliance, and Bunker Hill Community College
  • Residents representative of the diverse population of Chelsea and Revere

Past Events

March 25, 2021: Project Kick Off (Presentation)

Data and Resources

Households without internet access
DigitalDivide_HH_wo_Internet_ChelseaRevere
Provider Costs
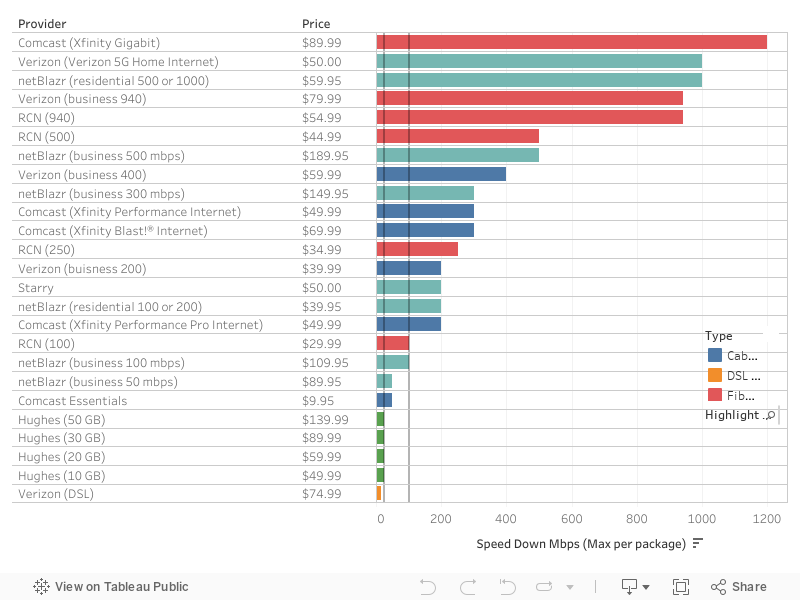
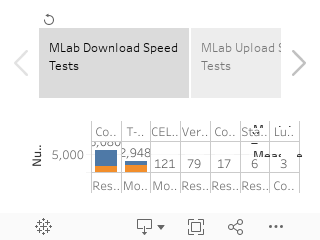
Download and Upload Speeds
Continue reading...

The Impacts of Land Use and Pricing in Reducing Vehicle Miles Traveled and Transport Emissions in Massachusetts

Background, blur, out of focus, bokeh. Traffic jams, road repairs, or accidents. Red brake lights of stopped cars

The Impacts of Land Use and Pricing in Reducing Vehicle Miles Traveled and Transport Emissions in Massachusetts

A research brief from the Metropolitan Area Planning Council

Published January 22, 2021

Authors:
Conor Gately, Senior Land Use and Transportation Analyst
Tim Reardon, Data Services Director

Executive Summary

In order to achieve Massachusetts’ ambitious greenhouse gas reduction targets, the state will need to improve substantially the fuel efficiency of cars and trucks and to pursue a complete transition to renewably-powered electric vehicles. Efficiency is only part of the solution, though. It also matters how much people are driving. All other things being equal, more vehicle miles traveled (VMT) necessarily means more emissions and greater demand for electricity. 

Both land use and the cost of driving are important factors in how much people choose to drive. When development is spread across the region, people need to travel farther to get to work or run errands, and it is less likely that they will be able to take transit for their trips. When gas prices and gas taxes are low and use of the roadway is essentially free, then drivers are less likely to opt for transit even when it is available. Regardless of how travel behavior changes post-COVID, these basic patterns and preferences are likely to persist. 

Using a pair of established land use and travel behavior models, MAPC has forecast growth in VMT by 2030 under various scenarios to estimate the relative impact of different land use patterns and pricing policies, alone and in combination with each other. Three land use scenarios represented different patterns of housing growth in the region, ranging from urban-focused to dispersed across many different types of communities. The pricing scenarios included gas tax increases, a VMT fee, and congestion pricing.   

  • Absent any major changes in land use or roadway pricing, VMT for personal vehicles is projected to increase by more than 21% between 2010 and 2030. Under such circumstances, fleetwide average fuel efficiency would need to improve to 29 miles per gallon by 2030 just to keep transportation GHG emissions from growing. Even a return to the Obama-era fuel efficiency standards would be insufficient to achieve this target given current rates of vehicle turnover.  
  • Land use patterns have a substantial impact on the rate of VMT increase: VMT growth in a “sprawl” scenario is 5.2 percentage points higher than a “smart growth” scenario with more development in urban areas and denser suburbs. These conservative estimates don’t yet account for the benefits of transit improvements or transit-oriented development, factors that will be addressed in the next phase of research 
  • Of the pricing policies tested, a straight 25-cent per mile fee had the largest impact, curbing VMT growth by about 15 percentage points. Congestion pricing, broadly applied, would have a slightly smaller effect. Our results also suggest that even a tripling of the gas tax would slow VMT growth by only one or two percentage pointsa much smaller effect than the smart growth land use patterns we examined 

These results indicate the Commonwealth cannot rely solely on technology-based solutions such as fuel efficiency and electrification to meet its ambitious GHG reduction targets. If VMT growth continues unabated, vehicle emissions could rise even as fuel economy improves, and rapidly increasing vehicle demand for renewable electricity will make it harder to transition other sectors to renewables. A reduction in VMT has other benefits as well: less congestion, more livable communities, and safer streets. Smart growth land use policies and user fees must be part of any comprehensive transportation sustainability strategy, but as we implement such policies, we must make sure they are designed and applied in ways that advance racial and economic equityWe must ensure that new user fees account for the income or assets of the payer. We must ensure access to fair and affordable housing in every community, especially near jobs, transit, and strong schools as a way to advance economic opportunity.  

MAPC pledges to continue its analysis into these issues to support effective state and local planning for mobility, climate, and equity.   

Introduction

Massachusetts has set ambitious goals for reducing greenhouse gas emissions and is currently developing updated plans to meet targeted reductions for 2030 and 2050. The transportation sector is the largest source of greenhouse gas (GHG) emissions in the Commonwealth; as such, it must achieve substantial reductions in emissions. Most transportation emission reduction strategies focus on technological and infrastructure solutions that will reduce the emissions per mile traveled: improved fuel efficiency of the internal combustion vehicle fleet, more widespread adoption of electric vehicles, and eventual transition to a fully electric fleet powered by renewable energy. Implementation of this pathway could yield dramatic reductions in emissions, but it will take time to transition the fleet and develop the scale of renewable resources to power all the state’s personal travel demand.   

Complete decarbonization of the transportation system requires time and renewable energy infrastructure, so a comprehensive climate plan cannot rely solely on efficiency and electrification if the amount of driving keeps rising unsustainably. Reduction of VMT must also be a key climate policy strategy, for a variety of reasons: continued growth in VMT will counteract and delay the benefits of efficiency improvements; more driving means expansion of carbon-intensive auto infrastructure and associated heat islands from additional impervious pavement; and auto-dominated landscapes diminish pedestrian safety and discourage active transportation. Curbing all these effects will require policies, practices, and behaviors that reduce trip lengths and shift more travel to transit, walking, biking, or other low-carbon modes. Infrastructure, land use, and pricing are all key factors for trip making and mode choice. In order to demonstrate the relevance of such strategies, MAPC analyzed the impacts of broad-scale land use changes and potential gas tax and roadway user fees in Metro Boston.  

MAPC modeled a range of VMT forecasts for the region, and found that, absent any major changes in land use or pricing policies, VMT for personal vehicles is projected to increase by more than 21% between 2010 and 2030, consistent with observed trends since 2010. In such a future, vehicle fuel efficiency would need to improve by at least 18% (to a fleet-wide average of 29 miles per gallon) before any net reductions in GHG are achieved. These estimates do not account for any long-term travel changes that may result from the COVID pandemic, the effects of which will not be fully known for many years. However, they provide a base-case scenario against which post-pandemic travel assumptions could be tested in future research efforts  

The base-case scenario was compared with a variety of alternative land use and pricing scenarios in order to assess the relative impact of various land use patterns, fuel taxes, and user fees. As described in subsequent sections, MAPC developed three land use scenarios and tested various combinations of taxes and fees. The initial results described here show that broad scale changes in land use patterns can have a substantial effect on forecast growth of VMT. User fees such as a VMT fee or congestion fee have an even larger effect. Patterns in land use can compound the effectiveness of all the pricing strategies. Our results also suggest that even a tripling of the gas tax would have little impact on the amount of driving.  

More work is needed to fully understand the complex interplay of factors affecting VMT. For example, none of the scenarios yet account for the benefits of improved transit service, transit-oriented development, safer active transportation connections, or expanded telework and delivery. More work is also needed to define how such scenarios could be achieved equitably, ensuring fair and affordable housing opportunities throughout the region and mitigating transportation cost burden on low-income households. Nevertheless, these results demonstrate that it is essential to pursue VMT reduction through a variety of means if technological improvements are to make headway on achieving ambitious GHG emissions reduction goals.   

Analysis

This report summarizes MAPC’s forecasts of VMT growth from 2010 to 2030 under a “business as usual” scenario, and the relative reduction potential of a suite of land use and transportation pricing policies. Central to this analysis are a complementary pair of land use and transportation modelsUrbanSim and VisionEvalwhich have been developed and deployed in a growing number of other metro areas around the United States. MAPC has spent the last year working to calibrate and tailor these models to the MAPC region. We use UrbanSim to create alternative land use scenarios for the region, each representing a different distribution of future growth across the region. The resulting outputs are then fed into VisionEval, which estimates travel demand and VMT for each land use scenario based on specified assumptions about the cost of gas and driving. The two models are described in more detail below.    

UrbanSim is a microsimulation model that allocates forecasted population, households, and employment growth in the MAPC region to individual census blocks based on household/employer preferences, existing land use, development potential, and other factors. Core inputs include land use controls (zoning), planned development, and travel times and costs (from the region’s travel demand model). The model allows MAPC to explore a range of future scenarios for population and housing growth, simulating different patterns of land use. Using this tool, we produced three different land use scenarios, each representing distinct land use growth patterns across the region. Each scenario had the same amount of population, household, and employment growth. They varied in the spatial distribution of an estimated 224,000 new jobs and 318,000 new housing units needed to accommodate projected population and household growth over the 20-year forecast period.  

Co-Benefits of Reducing VMT

In addition to reducing carbon emissions, it is worthwhile to recognize the additional benefits that efforts to reduce VMT can yield:

Investments in public transit are likely to be more effective job creators than roadway expansion projects. A study evaluating the job creation impacts of the American Reinvestment and Recovery Act (ARRA) in 2009 found that public transportation investments generate 31% more jobs per dollar than construction of new roads and bridges

VisionEval1 is a generalized transportation model that estimates the impact of different land use and pricing policies on vehicle travel. It does this by modeling the travel behavior of households along with their travel expenditures. Using data from the National Household Travel Survey and the Consumer Expenditure Survey, a suite of statistical models within VisionEval predict household vehicle ownership, household trips per day by mode, and the share of a household’s income available to be spent on travel, as a function of household and neighborhood characteristics. The model generates a “travel budget” for each household and compares it with the cost of trips available to the household via different modes (personal vehicle, ride-share/car service, transit, bike/walk). As the price of different modes changes, estimated household trips are re-allocated to satisfy the budget requirement. When the budget is spent, no additional trips (aside from bike and walk) are allocated to the household. Thus, as the price per mile of a vehicle trip increases (due to changes in the price of fuel, VMT fees, or congestion fees), the length and/or number of household vehicle trips is reduced. The relative impact of different pricing policies depends on the characteristics of each household and of the trips that it takes.  

VisionEval allows the user to evaluate a wide range of transportation policies, comparing their impacts on vehicle miles traveled and related greenhouse gas emissions. Model parameters include the future price of motor gasoline, the state tax on gasoline, per-mile taxes on VMT, congestion fees on freeways or arterial roads, changes in regional transit accessibility, and the pricing of parking in different model zones. Outputs of the model include average household-level VMT, transportation expenditures, vehicle ownership rates, TNC usage, vehicle CO2 emissions, and other indicators. Although not as comprehensive or sophisticated as a travel demand model that forecasts individual trip making behavior, the reduced complexity of VisionEval allows for more rapid evaluation of multiple scenarios. In this study, we focus on exploring the three land use scenarios in combination with the main pricing variables in the VisionEval model: the value of the gasoline tax, a per-mile tax on vehicle miles traveled, and a per-mile congestion fee applied to travel on highways. 

Land Use Scenarios

To create the alternative land use scenarios, MAPC specified the share of new household growth in each of four basic Community Types in the region: the high-density, transit rich Inner Core municipalities; outlying Regional Urban Centers (generally served by commuter rail); moderate density Maturing Suburbs; and lower-density Developing Suburbs. Municipalities within each of these community types share similar characteristics with regard to demographics, housing stock, existing land use, vehicle ownership, and household VMT.  

The base scenario, characterized as Trends of the 2000s,” represents future development patterns consistent with the 2000-2010 growth patterns across the region. The “Sprawl” scenario assumes resurgence of suburban housing development based on patterns of growth in the 1970s. The “Smart Growth” scenario is characterized by population growth focused on Inner Core municipalities, with considerably less growth in suburban areas. Employment growth by community type remained constant in each scenario though the distribution within community types varies since it is influenced by household allocation.  

The graph in Figure 1 and maps in Figure 2 show the different spatial patterns of population growth between 2010 and 2030 for the three land use scenarios. It should be noted that none of the scenarios target growth within each Community Type to specific transit-rich municipalities or transportation efficient locations (such as transit areas or town centers.) As a result, the differences between land use scenarios may be less distinct than would be created by more targeted assumptions and should be considered conservative estimates of the difference between scenarios. Also, since the UrbanSim model is still being refined and calibrated, these scenarios are intended to be illustrative; they are not intended to represent definitive forecasts for individual cities, towns, and neighborhoods. Our next phase of research will entail improvements to the model’s zoning and development inputs; and development of nuanced land use scenarios that assess the impact of land use policies that target growth to specific transportation efficient locations across the region and within municipalities.  

Figure 1. Comparison of share of household growth by MAPC Community Type for the “Trends of the 2000s”, “Smart Growth”, and “Sprawl” land use scenarios.

Figure 2. Percent change in households by municipality for the “Trends of the 2000s”, “Smart Growth”, and “Sprawl” land use scenarios. (Click each image to expand.)

Transportation Pricing Scenarios

This analysis focused on three main transportation pricing variables: the level of the statewide tax on motor gasoline; a per-mile tax on vehicle miles traveled, and a regionwide congestion fee on freeways, with the congestion fee varying as a function of the level of traffic congestion. While many other pricing and policy variables are available in VisionEval, we chose these to begin evaluating the relative impact of various approaches. We selected different combinations of the value of these parameters to create five future scenarios for evaluation.  

Our pricing scenarios tested three future levels of the statewide tax on motor gasoline: $0.24 per gallon (2020-level), $0.42 per gallon, and $0.75 per gallon, and two alternatives for a per-mile tax on vehicle miles travelled: $0.10 per mile and $0.25 per mile. We also tested the presence of a set of congestion fees on all freeways in the model region, with the level of the fee tied to the intensity of congestion occurring on the road, starting at $0.10 per mile for moderate congestion conditions, rising to $0.25, $0.50, and $1.00 per mile as congestion rose to heavy, severe, and then extreme levels. While we fully recognize the political and practical challenges with adopting many of the policies explored in this study, the three sets of pricing policies and their levels were chosen to explore the more ambitious limits of the price impacts on household VMT. None of these scenarios constitute a specific policy recommendation on MAPC’s behalf, instead providing waypoints on the path to large-scale reductions in regional VMT for the purpose of this analysis. 

Results and Analysis

The scenarios produce a wide range of forecasted VMT levels in the year 2030, as shown in Table 1. The businessasusual scenario, based on the Trends of the 2000s land use and no changes in transportation pricing, is estimated to result in an increase of 9.5 million household VMT per day, a growth of 21% over 2010 levels (estimated at 44.5 million VMT per day). With this level of VMT growth, technological improvements to vehicle fuel economy would have to yield an 18% reduction in per-mile carbon intensity just to break even on GHG emissions. Note that the VMT estimates produced in this study refer solely to household travel, and thus will differ from the total VMT numbers reported by MassDOT or the Boston MPO.

Since the average fuel efficiency of the Massachusetts passenger vehicle fleet was about 24.5 miles per gallon in 2010, it would need to rise to an effective fleet-wide average of 29 miles per gallon in 2030 in order to achieve a break-even point with carbon emissions. Whether that level of reduction is possible depends on a variety of factors: federal fuel efficiency standards for new cars, the rate of fleet turnover, the share of electric vehicles, and the carbon intensity of the electrical grid. Even if the Obama-era Corporate Average Fuel Efficiency (CAFE) standards were reinstated, fleet turnover would also have to increase substantially in order to achieve this target in the next 10 years. The scope of the technical improvements necessary to achieve GHG reductions (or merely restrain GHG growth) in the face of rising VMT underscores the importance of land-use policies that support VMT reductions. These reductions will be essential to fully reap the benefits of vehicle efficiency improvements in the timeframe needed to achieve the Commonwealth’s ambitious carbon mitigation targets.  

The results of the other two land use scenarios also indicate the significant role land use patterns play in regionwide VMT growth. Relative to 2010, the base Smart Growth scenario (with no pricing changes) predicts an increase in VMT of 19.0%, the base Trends of the 2000s scenario predicts an increase in VMT of 21.4%, and the base Sprawl scenario predicts an increase in VMT of 24.2%. This 5.2% spread in the VMT growth rate between the Sprawl and Smart Growth scenarios is equivalent to nearly 2.3 million vehicle miles travelled per day. As noted previously, these forecasts do not account for any land use policies that would target growth to specific locations within a Community Type, so the differences among them are conservative, but the relative impact of the Smart Growth scenario on VMT is still quite substantial. 

As expected, the model also forecasts that certain transportation pricing policies would have a substantial effect on future VMT, especially when applied in combination. We first explored the isolated impacts of increases in the gas tax of 18 and 51 cents above the current level of 24 cents per gallon. The resulting changes under the 18-cent increase were surprisingly small, with less than a 0.5% reduction in 2030 VMT compared with the scenario of no gas tax hike (Table 1). When the tax was raised 51 cents to 75 cents per gallon, VMT growth was reduced by 1.5% for the Trends of the 2000s and Smart Growth scenarios and by 1.2% for the Sprawl scenario. Even these reductions are smaller than the difference between the Smart Growth and Sprawl scenarios when no increase in the gas tax occurs. This means that the land use patterns can have an even larger effect than modest pricing policies: the Smart Growth scenario with the existing gas tax is better at curbing VMT growth than is a tripling of the gas tax under a Trends of the 2000s land use scenario. This result clearly demonstrates the substantial value of focused land use policies in restraining VMT growth, regardless of additional pricing policies. 

In the next scenarios we modeled the combined effect of the 75 cent per gallon gas tax with either a $0.25 per mile VMT tax, a tiered freeway congestion pricing fee, or the combination of both. For all of the land use scenarios, the separate addition of either the freeway congestion pricing or the 25 cents per mile VMT tax produced similar reductions in VMT, with the VMT tax having a slightly stronger effect (Figure 3). While neither additional policy produced net reductions in 2030 VMT compared with 2010,  VMT is projected to grow by only 2.8% in the case of the Smart Growth scenario with a 25 cent VMT fee and a 75 cent gas tax (Figure 3). For the Sprawl scenario with those same pricing policies, VMT could grow by 7.3%.  

These results indicate that fees must be set at relatively high levels to reduce significantly the growth in VMT, let alone to achieve any net reductions in VMT. This is due to the low priceelasticity of vehicle travel demand – a known feature of travel behavior that can be attributed partially to the lack of competitive alternative modes of travel in much of the region. Our analysis indicates that even a tripling of the gas tax may have only a modest effect on VMT, whereas VMT fees are a much stronger price signal.  

Why is this? Assuming pump prices (including tax) of $3.00 per gallon, fuel costs for a passenger vehicle with an average real-world fuel economy of 30 miles per gallon are roughly 10 cents per mile. A 51cent increase in the gas tax would raise per-mile fuel costs to 11.7 cents per mile. For someone who drives 10,000 miles per year, this change would increase their fuel costs by only $170 annually, not enough to prompt significant changes in the behavior of most drivers. Furthermore, the price signal of a per-gallon gas tax will weaken as drivers acquire more fuel-efficient vehicles. In contrast, a VMT fee of 25 cents per mile, applied to 10,000 miles of driving, would add $2,500 to annual operating costs – an amount significant enough to induce changes in where people live, how much they travel, and what travel mode they choose.  

DVMT_pct_change

Figure 3. Percent change in household daily vehicle miles traveled between 2010 and 2030 for different land use and transportation pricing policy combinations. Labels on X-axis describe scenario conditions in 2030.

The most ambitious scenario we modeled combines the $0.75 per gallon fuel tax, $0.25 per mile VMT tax, and freeway congestion pricing, which result in a substantial reduction in forecasted 2030 VMT below 2010 levels. The reductions are again differentiated by the three land use scenarios: Smart Growth VMT falls to 35.8 million per day (19.7% below 2010 levels), while Sprawl VMT falls to 37.0 million (16.9% below 2010). It is again worth noting that even with these ambitious pricing policies in place, the land use benefits of the Smart Growth scenario persist: 1.2 million fewer daily VMT compared to the Sprawl scenario.  

Description  DVMT 2030  % change from 2010 
“Trends of the 2000s       
$0.24 gas tax  54,121,000  21.4 
$0.42 gas tax  53,685,000  20.5 
$0.75 gas tax  53,559,000  20.2 
$0.75 gas tax + freeway congestion fees  47,719,000  7.1 
$0.75 gas tax + $0.25 VMT fee  46,746,000  4.9 
$0.75 gas tax + $0.10 VMT fee + freeway congestion fees  42,676,000  4.2 
$0.75 gas tax + $0.25 VMT fee + freeway congestion fees  36,340,000  -18.5 
“Sprawl”       
$0.24 gas tax  55,338,000  24.2 
$0.42 gas tax  55,226,000  23.9 
$0.75 gas tax  54,685,000  22.7 
$0.75 gas tax + freeway congestion fees  47,855,000  7.4 
$0.75 gas tax + $0.25 VMT fee  47,825,000  7.3 
$0.75 gas tax + $0.10 VMT fee + freeway congestion fees  43,571,000  2.2 
$0.75 gas tax + $0.25 VMT fee + freeway congestion fees  37,057,000  -16.9 
“Smart Growth”       
$0.24 gas tax  53,047,000  19.0 
$0.42 gas tax  52,933,000  18.8 
$0.75 gas tax  52,380,000  17.5 
$0.75 gas tax + freeway congestion fees  46,864,000  5.2 
$0.75 gas tax + $0.25 VMT fee  45,827,000  2.8 
$0.75 gas tax + $0.10 VMT fee + freeway congestion fees  42,881,000  3.8 
$0.75 gas tax + $0.25 VMT fee + freeway congestion fees  35,789,000  -19.7 

Table 1. Summary of all scenario results. Daily vehicle miles traveled (DVMT) by households in the MAPC region. DVMT from commercial and other non-household vehicles is not included.

Conclusions and Next Steps

The combination of land use and transportation pricing scenarios described in this report allowed MAPC to examine the relative impact of different policies on changes in VMT over a relatively short time horizon. Additional scenario testing is ongoing to explore the trends and impacts on travel behavior of the COVID-19 pandemic, including targeted growth within community types and individual municipalities and a range of post-COVID recovery scenarios. As VMT continues to recover from the lockdown lows of early 2020, it is important to assess what policies might be effective in shifting the region away from a return to the congested, high-VMT era that preceded the pandemic. Over the medium-term time horizon we are also testing additional policies expected to influence VMT in a more targeted fashion, such as parking pricing, changes in transit service and accessibility, increased telecommuting or part-time remote work, and more targeted fees (e.g., for ride-sharing services). While many of these policies have the potential to encourage substantial changes in household travel behavior and VMT, the analysis in this report underscores the vital importance of trends in housing development and residential location choice in determining future levels of personal vehicle travel. Therefore, as we seek to reduce GHG emissions from the transportation sector and decrease VMT as one tool in this pursuit that also generates co-benefits from less congestion and better air quality, it is clear that a smart growth strategy for housing and mixed-use development is a powerful ally. 

The fundamental allocation of people, households, and jobs across the region sets the conditions in which household travel decisions are made, and as seen in the Sprawl scenario, this can lead to a significant erosion of the impacts of other transportation or pricing policies. It is imperative that decisions on regional land use remain central to policy discussions on VMT and greenhouse gas emissions reductions. What our analysis also makes clear is that, in the absence of major interventions, growth in VMT will make it substantially harder for technological improvements in fuels and efficiency to achieve GHG reduction targets. Ambitious reductions in regional VMT will require ambitious policy interventions, some of which will have impacts well beyond the targeted activity of household travel behavior. These ambitious pricing policies risk exacerbating existing economic inequalities in mobility and accessibility, whereas the land use policies can be implemented in ways that benefit low-income and communities of color by expanding housing opportunity and job accessibility. In fact, more efficient land use can reduce transportation cost burden for low-income households, even in suburban locations. Explicit considerations should be made of the uneven socioeconomic effects of potential policies as they are being considered and designed with an eye toward advancing a suite of policies that achieve multiple wins in climate, public health, equity, and quality of life. 

Footnotes

1 VisionEval is an open-source transportation scenario planning and modeling platform. Originally developed by a partnership between the Oregon Department of Transportation and the Federal Highway Administration, it is now supported and maintained by the Collaborative Development of New Strategic Planning Models Pooled Fund, hosted by FHWA. Model development is open-source and ongoing, with members of the Pooled Fund including several state DOTs and MPOs. MAPC is currently in the process of joining the Pooled Fund. The open-source nature of VisionEval has allowed MAPC to develop a customized implementation of the VisionEval Regional Scenario Planning Model (VERSPM), adapted to use the outputs of the UrbanSim land use, employment, and housing forecasts in place of the included VisionEval default land use data.

Continue reading...

New TNC Fees Could Raise Over $100 Million Annually

Background, blur, out of focus, bokeh. Traffic jams, road repairs, or accidents. Red brake lights of stopped cars
New TNC Fees Could Raise Over $100 Million Annually

The Impacts of Land Use and Pricing in Reducing Vehicle Miles Traveled and Transport Emissions in Massachusetts

Published January 22, 2021

Authors:
Conor Gately, Senior Land Use and Transportation Analyst
Tim Reardon, Data Services Director

In order to achieve Massachusetts’ ambitious greenhouse gas reduction targets, the state will need to improve substantially the fuel efficiency of cars and trucks and to pursue a complete transition to renewably-powered electric vehicles. Efficiency is only part of the solution, though. It also matters how much people are driving. All other things being equal, more vehicle miles traveled (VMT) necessarily means more emissions and greater demand for electricity. 

Both land use and the cost of driving are important factors in how much people choose to drive. When development is spread across the region, people need to travel farther to get to work or run errands, and it is less likely that they will be able to take transit for their trips. When gas prices and gas taxes are low and use of the roadway is essentially free, then drivers are less likely to opt for transit even when it is available. Regardless of how travel behavior changes post-COVID, these basic patterns and preferences are likely to persist. 

Using a pair of established land use and travel behavior models, MAPC has forecast growth in VMT by 2030 under various scenarios to estimate the relative impact of different land use patterns and pricing policies, alone and in combination with each other. Three land use scenarios represented different patterns of housing growth in the region, ranging from urban-focused to dispersed across many different types of communities. The pricing scenarios included gas tax increases, a VMT fee, and congestion pricing.   

  • Absent any major changes in land use or roadway pricing, VMT for personal vehicles is projected to increase by more than 21% between 2010 and 2030. Under such circumstances, fleetwide average fuel efficiency would need to improve to 29 miles per gallon by 2030 just to keep transportation GHG emissions from growing. Even a return to the Obama-era fuel efficiency standards would be insufficient to achieve this target given current rates of vehicle turnover.  
  • Land use patterns have a substantial impact on the rate of VMT increase: VMT growth in a “sprawl” scenario is 5.2 percentage points higher than a “smart growth” scenario with more development in urban areas and denser suburbs. These conservative estimates don’t yet account for the benefits of transit improvements or transit-oriented development, factors that will be addressed in the next phase of research 
  • Of the pricing policies tested, a straight 25-cent per mile fee had the largest impact, curbing VMT growth by about 15 percentage points. Congestion pricing, broadly applied, would have a slightly smaller effect. Our results also suggest that even a tripling of the gas tax would slow VMT growth by only one or two percentage pointsa much smaller effect than the smart growth land use patterns we examined 

These results indicate the Commonwealth cannot rely solely on technology-based solutions such as fuel efficiency and electrification to meet its ambitious GHG reduction targets. If VMT growth continues unabated, vehicle emissions could rise even as fuel economy improves, and rapidly increasing vehicle demand for renewable electricity will make it harder to transition other sectors to renewables. A reduction in VMT has other benefits as well: less congestion, more livable communities, and safer streets. Smart growth land use policies and user fees must be part of any comprehensive transportation sustainability strategy, but as we implement such policies, we must make sure they are designed and applied in ways that advance racial and economic equityWe must ensure that new user fees account for the income or assets of the payer. We must ensure access to fair and affordable housing in every community, especially near jobs, transit, and strong schools as a way to advance economic opportunity.  

MAPC pledges to continue its analysis into these issues to support effective state and local planning for mobility, climate, and equity.   

How Much Money Could This New TNC Fee Structure Raise?

Using 2019 TNC trip data provided to the Department of Public Utilities and information gathered through MAPC’s Fare Choices report, we have estimated the revenue this new fee structure could generate in the table below.  

Since ridership is down during the pandemic, we’ve estimated two revenue scenarios: one with current levels of TNC ridership (about 50% of 2019 levels)1 and one with a return to 2019 levels of TNC use. 

In 2019, there were 91.1 million TNC trips. The $0.20 fee on every trip generated $18.2 million in revenue: 

  • $9.1 million went to cities and towns 
  •  $4.6 million went to the Commonwealth Transportation Fund 
  • $4.6 million went to the MassDevelopment taxi/livery fund  

As we show in the table below, the revenue for each of the new fees is distributed differently to three buckets: cities and towns, the Commonwealth Transportation Fund, and transit agencies. 

If pandemic-levels of TNC use continue, under this new structure, municipalities would receive an additional $3.9 million in new revenue, for a total of nearly $13 million.

The Commonwealth Transportation Fund would also see a significant increase in revenue. In pandemic conditions, this new structure could generate up to $25.4 million in revenue for the CTF, up $20.8 million from 2019.

The MBTA could receive between $12.5 million and $25 million if the Transit Authority Fund and Public Transit Access Fee revenue are combined.

TNC Revenue Generation and Distribution Under Proposed Fee Structure

Click + to see how funds are allocated.

Fee Type

Pandemic Ridership
(50% of 2019 Levels)

Pre-Pandemic Ridership (100% of 2019 Levels)

Shared and Solo Ride Fee
(assumes 20% of rides are shared2)

$47.4 million

$94.7 million

Public Transit Access Fee
(Applied to 75% of all rides3)

$6.6 million

$13.2 million

Luxury Fee
(5% of all rides)

$2.3 million

$4.6 million

Total Revenue

$56.2 million

$112.4 million

Based on these estimates, below is approximately how much revenue could be allocated to cities and towns, the Commonwealth Transportation Fund, MassDevelopment, and transit agencies annually.  

Funding Distribution by Recipient  50% of 2019 Levels  100% of 2019 Levels 
Municipality of Ride Origin  $13 million
$26 million
Commonwealth Transportation Fund   $25.4 million
$56.8 million
Massachusetts Development Finance Agency4 $6 million
$6 million
MBTA  $5.9 million
$11.8 million
Regional Transit Authorities    $5.9 million
$11.8 million
Total Revenue   $56.2 million
$112.4 million

Adopting this new TNC fee structure would raise muchneeded revenue for local and statewide transportation investments, promote more sustainable travel, and alleviate congestion we know will rebound as the Commonwealth reopens. We applaud the Legislature for including this provision, as well as the TNC data sharing requirements, in the bond bill, and urge the Governor to quickly sign the bill.  

Footnotes

1 Current estimates of TNC use is based on Lyft’s Q3 2020 Earnings Report. 

2 MAPC’s Fare Choices report: https://www.mapc.org/farechoices

3  From Department of Public Utilities’ 2019 Data Report: https://tnc.sites.digital.mass.gov

4 The first $6 million allocated to the Commonwealth Transportation Fund annually will go to the Massachusetts Development Finance Agency. 

Continue reading...

Evictions and COVID-19: The Responsibility of the Large Landlord

Highway Traffic at Sunset
Evictions and COVID-19: The Responsibility of the Large Landlord

TNC Fees Could Raise Over $100 Million Annually For MBTA, Municipalities, & More

The Responsibility of the Large Landlord

Published January 13, 2021

Fees on ride-hailing trips proposed in the new transportation bond bill could raise over $100 million annually for the MBTA, other regional transit authorities, municipalities, and the Commonwealth Transportation Fund.  

The Legislature recently passed H.5248, An Act authorizing and accelerating transportation investment, a $16.5 billion, five-year transportation bond bill. In addition to many important project authorizations, the bill includes several policy items that will help build a more robust, reliable, and affordable transportation system. One part of the bill increases fees on ride-hailing trips taken with transportation network companies (TNCs) such as Uber and Lyft. MAPC strongly urges the Governor to sign these new TNC fees into law to encourage shared rides, reduce traffic and greenhouse gas emissions, and put Massachusetts on par with other states’ TNC fees.  

Today, there is a $0.20 cent fee on all TNC rides in the Commonwealth, with revenue split between the city or town where rides initiated, the state’s transportation fund, and a fund to help the taxi/livery industry.  

The bond bill proposes different fees for shared rides ($0.40) and solo rides ($1.20) and creates two new fees. In addition to a $1.00 fee on luxury rides in higher-end vehicles, the bill proposes a public transit assessment ($0.20) that would apply to trips that both start and end within the 14 municipalities that comprise the core MBTA service area 

Cities and towns have been putting their current TNC dollars to creative use, investing in transportation projects ranging from dedicated bus lanes to bicycles and helmets for municipal staff. The new fee structure will increase the amount of money cities and towns receive so they can continue to make local transportation improvements.  

These fees will also offer some financial support to the MBTA, though it is clear that we still need significant new revenue for the T in order to address longstanding capital and operating deficits. But enacting this new fee structure is an important first step and will align Massachusetts’ regulations with other TNC fees across the country. 

Since large corporate landlords were responsible for a disproportionate share of evictions during pre-pandemic times, they will also have a critical role to play in preventing an eviction crisis in the coming months.

In recent weeks, 53 owners and landlords have signed onto the state’s Eviction Diversion Pledge – a five-part commitment. The landlords pledge to abide by the CDC moratorium; to proactively work with tenants to create payment plans; to accept rental assistance payments; to promote rent adjustments for voucher holders; and to engage in structured and interactive mediation. The landlords who have signed the pledge should be applauded for their leadership.

Other landlords have shown a reluctance or have refused to sign on. While there are 53 owners who have signed the pledge, there are over 1,600 large and very large corporate owners in Boston. Who are the owners who haven’t signed the pledge and what is their history of eviction?

We identified 18 large and very large corporate landlords linked to at least 30 evictions each across the two-year study period. The list includes both those who both signed and did not sign the Eviction Diversion Pledge. Collectively, these landlords owned an estimated 10,800 units and were associated with more than 1,700 evictions in Boston alone, approximately 17% of the total. The lists below specify which owners and operators have and have not yet signed the Eviction Diversion pledge:

The eight owners who have signed the pledge conducted an average of 75 evictions per year during the study period, so it is particularly meaningful that they have chosen to suspend those actions for the time being. Those who have not signed the pledge were, on average, associated with approximately 25 evictions per year during pre-pandemic times, making them worthy of scrutiny and further encouragement to sign the pledge. Collectively, those who have not signed own over 4,000 units and were responsible for approximately 5% of the total evictions between 2015 and 2016. If we can convince these landlords to sign on to the pledge—and to follow through on its commitments—we can take a small step in keeping people in their homes

We recognize that this analysis is based on patterns of evictions from four and five years ago. It doesn’t provide a definitive indication of what landlords are filing cases now or pressuring their tenants in other ways. Therefore, more needs to be done to assess the current situation. This may include collecting data from the Massachusetts Court System about evictions filed since October in order to identify landlords responsible for an outsized share of filings. Analysts should also assess whether some landlords are refusing to accept RAFT payments or refusing to engage in pre-court negotiations in good faith.

Of course, more needs to be done at the state and federal level to provide a more systemic response to the current crisis. Since the CDC moratorium is now scheduled to end on January 31, even those who have signed the pledge will be free to evict unless the moratorium is further extended. The state and federal government need to take affirmative steps to preserve tenancy for those facing eviction; and to provide rental assistance support sufficient to meet the needs of tenants and landlords.

Many parties have a role to play in protecting tenants during these challenging times. We hope that this analysis will spur outreach to landlords who have not yet taken a leadership role, prompt additional collaboration to understand this crisis, and support an effective response to the looming possibility of an “eviction tsunami.”

1 Current estimates of TNC use is based on Lyft’s Q3 2020 Earnings Report. 

2 MAPC’s Fare Choices report: https://www.mapc.org/farechoices

3  From Department of Public Utilities’ 2019 Data Report: https://tnc.sites.digital.mass.gov

4 The first $6 million allocated to the Commonwealth Transportation Fund annually will go to the Massachusetts Development Finance Agency. 

Continue reading...

Exploring Youth Mental Health Access in North Shore/Cape Ann Communities

Exploring Youth
Mental Health Access

in North Shore/
Cape Ann Communities

This digital report summarizes findings from focus groups, surveys, and in-depth research on the topic of youth mental health in the Cape Ann area of Massachusetts.

Contact

Amy Epstein, Regional Prevention Director, City of Gloucester

[email protected] | 978-325-5272

Report Authors:

Alyssa Kogan, Regional Planning Data Analyst

Elaine Zhang, Public Health Planner

Report Design: Elise Harmon, Digital Communications Specialist

Funding:

regional youth prevention network logo

Project Background

Youth Mental health in North Shore/Cape Ann Communities

Mental health, specifically youth mental health and access to behavioral health services, has become an important priority in the North Shore.

In 2019, the city of Gloucester hosted one of several statewide listening sessions held by Massachusetts Secretary of Health and Human Services Marylou Sudders in order to better understand what barriers and challenges residents face around mental and behavioral health.

Common themes and challenges identified through these listening sessions included lack of mental health providers within the North Shore/Cape Ann Area, insurance, and long wait times for counseling sessions.

The Youth Risk Behavioral Survey (YRBS), which is conducted every two years, assesses health related behavioral issues in youth that contribute to leading of death and disabilities in adults. Survey data from the most recent year (varies for each community since survey is conducted every two years), indicate there are growing mental and behavioral health needs in the region.  As seen in the first graph, high school students within the region report having felt depressed or seriously considered suicide at higher rates than Massachusetts’s average. Regarding substances, high school students within the region report lower rates of current usage for alcohol and marijuana when compared to MA but higher rates of current usage for vaping.

Data: Youth Mental Health on Cape Ann

Data: Youth Mental Health in Cape Ann

The 2019 Beth Israel Lahey Health Beverly Hospital and Addison Gilbert Hospital Community Health Needs Assessment (CHNA) identified mental health as one of the top four priorities in the community benefits service area that includes Gloucester and Cape Ann municipalities (Essex, Gloucester, Manchester-by-the-Sea, Rockport). Mental healthincluding depression, anxiety, stress, serious mental illnesses, and other conditionswas a major issue across all demographics and socioeconomic populations. In fact, mental health was the issue that people in the community struggled with the most (49%). Among the groups, youth and older adults emerged as priority populations most affected by mental health issues. According to the CHNA, youth reported feeling increased pressure to succeed in school activities, challenges with peers due to social media, and formation of positive interpersonal relationships.

The Lahey Hospital Community Health survey indicated that mental health was the issue that people in the community struggled with the most (49%).

Project Overview

The Gloucester Health Department was awarded a multi-year Tower Foundation grant to identify barriers and challenges faced by North Shore/Cape Ann residents, specifically children and youth, when attempting to access mental health services.

As part of that work, the Regional Youth Prevention Network (RYPN) conducted a series of focus groups with area parents and young people to directly hear their views on youth mental health access with the goals of better understanding additional barriers and challenges parents and youth face when trying to access mental health services. The RYPN asked the Metropolitan Area Planning Council (MAPC), Greater Boston’s Regional Planning Agency, to facilitate and develop a report detailing the findings and recommendations from the focus groups.

Types of Mental Health
Access Points

Outpatient care: Covers a wide variety of care settings that are not overnight, and can include private practice, group therapy, community mental health centers, among others

Inpatient care: Admission to a hospital for overnight care

Schools: Can include care provided by school resource officers, adjustment counselors, licensed mental health professionals, or teachers

Community-based organizations: Nonprofit groups that provide local mental health services or alternative learning models

Methods

Focus Group Guide Development:  

Click here for the
focus group questions

Development of the focus group questions was an iterative and collaborative process between MAPC, GHD, and The Regional Youth Prevention Network. MAPC developed a set of draft questions aimed at understanding barriers and identifying resources that helped connect parents and youth to the care they were looking for. These draft questions were shared with GHD, who helped prioritize a second draft of the question set. This second set of draft questions was shared with the Regional Provider Network, who were asked to prioritize questions they felt were most important. Additionally, MAPC and GHD used this network’s expertise to ensure the questions were phrased in a trauma-informed manner to ensure a safe and positive experience for participants. The process resulted in a final set of 10 questions for the focus groups. Questions were adjusted slightly (e.g., changing from “you” to “your child”) for parent and youth focus group to ensure vernacular is understood between groups. See appendix for full focus group guide.

Recruitment:  

Flyer for
recruitment

The target focus group participants were youth and parents who had attempted to access youth mental health services within the last year. GHD worked with their network of stakeholders to recruit the target population for the focus group. MAPC developed a flyer for GHD to distribute to potential participants that provided more details about the focus groups. See appendix for a focus group flyer.  

Focus Group Participation
Qualitative Analysis
COVID-19 Limitations
Data Limitations

Top Five Themes

MAPC identified five primary themes based on a final coding and analysis of the focus group data. Focus group participants mentioned a variety of factors that either prevented them for accessing services or enabled them to do so.  Even as different participants may have described preventive or enabling factors differently, MAPC staff was able to group similar issues into these five major themes described below. For example, barriers to using certain types of insurance or difficulties maintaining continuity of care were often mentioned as barriers to accessing mental health services but can both be linked to an underlying root cause faced by parents and youth, I.e., the challenges of navigating the mental health and health care system.

Lack of Providers

The limited number of youth mental health service providers on Cape Ann is a primary contributing factor to many of the other challenges that focus group participants enumerated, such as long wait times, having to travel far distances to reach a provider or access specialized care. Almost all focus group subsets mentioned insufficient provider availability. The broad extent of this theme suggests that it is a root cause of other barriers to mental health access. School officials noted that when they refer students, unless they have personal connections already established with providers in the area, their students endure long wait times to get to a provider. Many parents noted a shortage of clinicians that specialize in adolescent care (specifically child prescribers), and once they can find a therapist and establish a connection, the clinician often leaves, highlighting an issue with clinician turnover. This also begs the question: What is contributing to such a large clinician turnover in the area; is it low pay, insufficient support, lack of benefits, or something else? This could be an area of future research to discuss directly with providers.

Navigating the System

Navigating the mental health care system was an underlying issue when focus group participants spoke about attempting to access care, particularly in terms of insurance coverage, identifying a clinician that fits the unique needs of families and youth, and continuity of care. One parent focus group participant who works in the field of mental health care said, “If you don’t know how to navigate these systems, and even if you do, you’re still kind of screwed. You know, it’s a lot of work.”

Insurance coverage was the number one barrier parents identified when trying to navigate the mental health system. Parents often spoke about how time consuming it is to find a clinician or provider that meets their needs and accepts their insurance. As a result, some parents mentioned paying out-of-pocket for their child to see a clinician to avoid long wait times. Moreover, parents told of gaps in coverage due to dual insurances. One parent shared that her disabled son is covered by her employer’s insurance as well as MassHealth. Generally, when individuals have dual insurance, the primary insurance is billed first and then MassHealth is billed secondarily if the primary insurance doesn’t cover a specific service. This parent reflected on a recent experience where they attempted to access mental health services and were denied coverage by both their primary insurance and MassHealth.

Continuity of mental health care, or the quality of care over time, was another barrier parents identified when trying to navigate the health care and mental health care system. Parents noted the lack of wraparound services after being discharged from inpatient treatment. Another example of where continuity of care has posed serious barriers for parents and youth is when students transition back to school after being absent for an extended period. Due to siloed communication among sectors, such as health care and schools, schools are often unaware of sensitive situations the student may be experiencing, making it harder for students to assimilate back into the school environment.

Interactions with Coordinators and Clinicians

The manner in which youth and adults felt they were treated by those they sought assistance from in accessing services and those who provided them clinical care emerged as a significant theme.

Focus group participants shared positive experiences if they felt that their needs were understood by those helping them find clinical support or if they developed a personal connection with their provider. Conversely, participants that described feeling a sense of disrespect, condescension, or lack of compassion from such parties reported negative experiences. These negative experiences were widespread among focus group participants. Many shared stories about such interactions across the spectrum of mental health care – within the schools, in outpatient and inpatient settings, and in engaging care coordinators. Some youth specifically lamented a lack of privacy and confidentiality with their outpatient provider. Other words used to describe unfortunate interactions ranged from “dismissive” to “unresponsive” to “rude.”

Although it’s not possible to objectively determine a lack of compassion, there was clearly a perception among youth and their parents that providers did not always treat them in a respectful and compassionate manner, a factor that exacerbated the sense that the system was not accessible to those in need of youth mental health services.  

What We Heard

“I think more teaching around empathy is important…Then you have to go to a school or to whomever to ask for help… their response to you can either be really off-putting or can make you feel really safe. You know, sometimes therapists are so busy, billable by whatever increments, and you got to have their billable rate, you know, at time. Sometimes it’s like a factory. So I think making it almost like a more humanizing experience again. Like, that they want to be there and connect.”

— Parent Focus Group Participant (March 2020)

What We Heard

“It’s kind of like — so I’ve actually had an experience with that before where this one place that my brother and I got therapy at — he’s about eight years younger than me and him and I both had issues with each other. The two people that we saw, the two therapists, would constantly say back and forth information about him to mine and mine to his, tons of HIPAA violations and everything. It’s just like that’s not how you run a therapy place. That’s going to get both the therapy place shut down and the people not getting therapists.”

Youth Focus Group Participant (February 2020)

What We Heard

Female Student: “And it’s also like you’re trying to keep this information confidential and then they go and break that barrier. How are you going to get any help at that rate?”

Male Student: “Yeah and it’s not even things that they have to report, too.”

Youth Focus Group Participants (February 2020)

Role of Schools as an Access Point

The role schools play in responding to mental health issues was a prominent theme mentioned in all focus groups. Perspectives on the role of schools varied based on the respondent (parent, youth, school stakeholder) and school district they came from. Identified school-based barriers included insufficient resources (e.g., not enough staff to handle the volume of students that need mental health support), mental health issues handled in a disciplinary manner, and “cookie-cutter” education curriculums. Youth and parents also shared they often felt there was a lack of compassion and trust from teachers in the public school system when they would report on what they were going through. Schools were also identified as an important facilitator in aiding parents and youth in accessing needed care. Specifically, parents noted schools at times played a key role when there were staff willing to champion and advocate for their child’s specific needs, which in turn helped students meet their interim mental health needs or receive a referral to see an outpatient clinician.

Stigma and Perception of Mental Health

Stigma and the negative perception of mental health illnesses was often a concern of parents and youth when trying to access care. A frequently mentioned source of stigma occurred when youth needed to leave school for an extended amount of time for treatment related to mental health challenges. Parents and youth often mentioned how difficult the transition back into school was, and how they felt they were viewed negatively or treated differently. Parents and youth often reported feeling disrespected by schools when dealing with mental health challenges. One parent said that “the school professionals were really kind of condescending and really made me feel like maybe there’s something I’m not doing right.”

Youth also reported feeling a lack of support from their parents when requesting mental health care. A number of youths shared that their parents refused to believe that their children needed care and expressed fear that their reputation within the community (i.e., workplace, neighborhoods) might be jeopardized. Additionally, participants perceive North Shore communities to be smaller in population and more insular with little privacy “because everyone knows everyone so if you’re in therapy then everyone’s going to know.”

What We Heard

“It’s hard. Because try to be in that kid’s place of trying to go back when, like, everyone knows everything about you. And you are walking down the hall, and yes, they are looking at you. And you are trying to function in a normal place, and you’re a teenager, and that means so much to you. So it’s hard. I think — I don’t know how many of them successfully come back into school and feel good about it.”

Parent Focus Group Participant (March 2020)

Findings

Focus group participants described various points by which they connected with youth mental health care. Below were the four most common access points identified by parents and youth: each highlighting respective barriers and benefits. 

Existing Community Based Organizations

Parents and youth shared examples of how existing community-based organizations or alternative learning models have been able to provide the services that met their needs or connected them to external providers for additional help. Some youth shared that they decided to choose an alternative education pathway when the traditional public-school curriculum did not align with their mental health care needs. Parents who utilized the community-based organizations often noted that they were connected to these organizations through word of mouth or through the recommendation of schools. Parents and youth tended to speak positively about their experiences at existing community-based organization once they were seen.  

Barriers

Benefits

What We Heard

“I had a really good therapist at [provider name redacted]. I just can’t go anymore because of our insurance.”

Youth focus group participant (February 2020)

“As far as [provider name redacted] goes, my son’s been on a wait list there since September. And I’ve had him on a wait list for a month another place in Beverly since the beginning of October.”

Parent Focus Group Participant (March 2020)

“I didn’t want to go to [provider name redacted] because at the agencies like that you see the turnover rate so fast, so they do just decide to leave. And, you know, these kids—that’s what happened. He had a really great therapist, but she went private and kind of had turned away from taking kids.”

Parent Focus Group Participant (March 2020)

Outpatient Care

The most common setting for youth to receive mental health care is in an outpatient setting. Many care touchpoints eventually lead to therapy, whether through direct connections or referrals from school officials, community-based organizations, or inpatient care.

Barriers

Benefits

What We Heard

“And I think there’s a real dearth of available counselors and prescribers and programs in this area. We also did like a three-months DBT workshop, again, in Salem. That’s not something that was offered anywhere locally, so people that have those needs here might be completely unable to access—even if you find something that could help you—completely unable to access that. So I think that’s, in general, a barrier for a lot of people.”

Parent Focus Group Participant (June 2020)

“Yeah, I mean, I feel pretty lucky in that I have pretty decent insurance. That said, nutrition counseling, for example, is maxed out at 12 sessions. Well, someone with an eating disorder can’t stop nutrition counseling after 12 weeks. You know? And the first three months, they need to be seeing that nutritionist every week. So in three months you’re out of your nutrition, so now you’re paying cash at $200 for nutrition counseling. And what do you do here, right? This is your child’s health, so you’re going to try to prioritize that over anything else. Now, what if you—to me, $200 is significant but it’s not the end of the world. To some people, $200 is two weeks of groceries. What do you do now? Or that’s a week’s rent or what have you, and how can they prioritize that over access to… So they’re not going to go to the nutritionist, right? So I can see that overall we’ve managed, but I can see that you don’t have to step down too far for that to be unmanageable.”

Parent Focus Group Participant (June 2020)

“They might send a kid to a program for three days, but that doesn’t address their problems. And then they end up just sending them back into the same program, you know, the same setting that kind of triggered what happened before, and they’re not getting any better. So I guess transition services, so if you do need the help you kind of need someone with you there through the process and not just kind of being, you know, okay, you’re done. You’re cleared now, go home, and then things act up again. That’s a problem.”

— Parent Focus Group Participant (June 2020)

“You see a lot of great progress and support when there are other agencies for [youth] to connect with. And so during these transition periods from middle school to high school to college to a working career, these are still young adults; there’s not enough support, as well as, I think, not enough for kids who might not be doing too bad but still have the potential to really backslide and not reach their potential without some outside assistance.”

— Parent Focus Group Participant (June 2020)

“I reached out to her pediatrician, and he gave me three recommendations, and no one could see her off that list, however, I did get one clinician on the phone who was able to tell me about another agency. And they didn’t have one, but they were able to get me the in-home therapist to do, like, family therapy. And then it got better from there.”

— Parent Focus Group Participant (June 2020)

“You have to have some sort of background knowledge here. If you don’t have any kind of perspective on this problem at all as a parent, you’re really, really underwater. You would have no idea how to go about this. If you don’t know yourself or have friends who know how to navigate things like asking, advocating for the things you need, or know what to advocate for, then I don’t know how you would ever get really what you needed. It would just be dumb luck, really. That’s sort of my sense.”

— Parent Focus Group Participant (June 2020)

“As a parent, just being that annoying person, unfortunately, which puts you in an awkward position, but seems sometimes the parents for the individual is the strongest advocate and support.”

— Parent Focus Group Participant (March 2020)

“The [therapist] that we have now was a complete word of mouth, because I just tell everybody, does anybody know anybody? Does anybody know anybody? And they’re like, ‘Nobody’s taking anybody’.

Nobody’s taking patients, and then somebody gave me the name of somebody who is actually an elderly neighbor’s of mine. And their granddaughter was seeing somebody, and they said, ‘Oh, she sees so and so.’ And so I called and left a message, and I did say ‘I heard about you from so and so.’ And she actually called me back and said ‘do you want to come in tomorrow?’

And she was completely overbooked, but she said, ‘Because you mentioned that you knew somebody, and I really respect that family.’ And so now we’re seeing somebody regularly, but it was not with any help from [a behavioral health organization]. It was not with any help from school. It was just my own desperation of not giving up. And it just feels like there’s nothing to help us.”

— Parent Focus Group Participant (March 2020)

“I would say one of the more positive aspects was once we had someone to work with, then referrals from that clinician were better as we sought to get a more focused or a better connection or once something wasn’t working. But we sort of already had to be in some sort of a system before we could access that knowledge.”

— Parent Focus Group Participant (June 2020)

Schools

The public school system’s role and responsibility in handling youth mental health issues was a prevalent theme across the youth and parent focus groups. From the perspectives of parents and youth, participants felt that the school systems were not accommodating of their mental health needs which resulted, at times, in the disruption of learning. Youth often voiced their frustration around how restrictive traditional public school curriculums are and how the curriculum did not allow enough flexibility for creative learning methods. In response to the prevalence of schools in focus group conversations, MAPC also conducted key informant interviews with school representatives to ensure there was a more nuanced understanding of the barriers.

Focus Group Participants: Barriers

Focus Group Participants: Benefits

What We Heard

“So the counselor at the school was like, ‘Does she have a therapist?’ And I said, ‘No. I don’t even know where to go. Do you have any recommendations?’ And she said she was going to get back to me. I think it was almost three weeks, almost an entire month, I kept asking her, and she never got back to me. So in the meantime things kept escalating, and I was having to leave work every day. And I was on the verge of losing my job.”

Parent Focus Group Participant (June 2020)

“Everybody’s so different and they have their own ways that they need to go but they’ll still punish you if you can’t fit into that way that they want you to fit in. And it does not make sense. And then when you get punished nothing gets fixed, you just get punished and then put back in the environment and set up to fail again. And when you’re expected to fail you’re more likely to fail because they’re expecting it from you.”

Youth Focus Group Participant (February 2020)

“Some teachers are really awesome, like [name redacted] is a really awesome teacher. She made my freshman year so much better because I don’t think I would’ve survived freshman year. I was failing a few classes and…one of the awesome things that she did was she asked what she should know as a teacher about the student and about our lives. And she gave me more leeway, which I really did need because I was really struggling at that point.”

Youth Focus Group Participant (February 2020)

School Officials: Barriers

Inpatient

Youth can receive inpatient care (i.e., admission to a hospital for overnight care), when they experience a mental health crisis. Pathways leading to inpatient care can involve parents, schools, or even the youth themselves.

Barriers

What We Heard

“I have a very similar situation right now with my son, spending almost an entire week in the ER with him after calling 911 for help, and an EMT telling me that he couldn’t help the situation, he couldn’t help that my son and I had a poor relationship and that he didn’t feel that it was an emergency, which was a horrible feeling, for somebody to tell you that when you’re in the middle of a crisis.”

— Parent Focus Group Participant (March 2020)

“And so then they took [my daughter] from [the crisis center] to the ER, and we spent four days in the ER. And it was awful. You know, locked in a room, because you’re in lockdown and being the victim she felt like she was being locked up. It was like she was the criminal. And then finally from there we took an ambulance ride to [another ER] and they had a bed for her. But we got there, it was 6:30 at night, and a nurse came down and met us and then locked us in this little tiny room and we filled out paperwork. They took her and went to this room, a small room also, strip searched her, and then had us locked in that room for two and a half hours with nothing. They said, ‘The doctor’s going to be by.’ We finally went up and said, ‘What is going on? You know, we’ve been doing this forever’…We went on a Friday night. There was nothing all weekend. So come Monday she was done.”

— Parent Focus Group Participant (March 2020)

Recommendations

The focus groups and stakeholder interviews highlighted numerous barriers that parents, youth, and educators face in obtaining access to mental health services, but participants also suggested several potential solutions that build on what is currently working well across the region.

Below are examples, identified from participants, that provide a pathway to drive more systemic changes. The examples also highlight that the region is already making progress which is important to ensure that momentum is sustained. The following recommendations seek to encourage and reproduce the numerous enablers for youth mental health services cited by parents, youth, and school-based staff.

capeann1

Training

Model: Psychological First Aid/Teen Mental Health First Aid/Crisis Intervention Training

At a regional level, school districts and local law enforcement have undergone Mental Health First Aid and Crisis Intervention trainings. In order to ensure that mental and behavioral health issues are handled in a consistent and trauma informed manner, training should continue to be provided for school personnel, law enforcement, and expanded to include first responders.

Initial Action Steps:

  • Schedule two school personnel trainings in 2021
  • Conduct evaluation to assess mental health literacy among school personnel

Recommendation #1: Improve how mental health issues are addressed within public schools

Train all staff and educators on trauma-informed mental health literacy, including understanding warning signs for mental health issues

Action Steps:

  1. Provide regular and refresher trainings for all school personnel that interact with students on a regular basis. Trainings such as Mental Health First Aid and Youth Mental Health First Aid should be provided to all new staff. Refresher courses should be offered for staff every 2 years following their initial training.
  2. Provide targeted trainings for educators and other school officials around mental health issues that are more prevalent and unique to each high school (i.e., suicide, substance use, anxiety, etc.).
  3. Provide training on trauma-informed care interventions geared specifically towards educators.
  4. Conduct biennial evaluation to assess mental health literacy among school staff and educators.

Why?

Parents and school officials often mentioned the need for increased mental health literacy among staff and teachers that interact with students on a daily basis. With increased mental health literacy among staff and educators, the hope is that responses to mental health issues happen in a timely, effective, and compassionate manner.


Create multiple systems of supports for youth and expand current support systems
Secure funding to provide multiple levels of support
Establish and enhance meaningful and trusting relationships with existing community-based organizations and new potential partners
capeann5

Support Systems

Model: Gloucester Youth Leadership Council (GYLC)

In wading through the mental health system and navigating the challenges of either experiencing a mental health condition or having a family member with a mental health condition, focus group participants, particularly parents, expressed a desire to connect with other parents both as a source of support and empowerment.

The Youth Leadership Council, convened by the Gloucester Health Department, is a group of teens that works to make positive impacts in the community around issues that impact teen health, also creating a space for teens to connect, share experiences, and have an impact.

Initial Action Steps:  

  • Invite participation from Cape Ann youth for the next four council meetings
  • Test model for incentivizing participation
navigation

Navigation

ModelThe Navigator Role

Focus group participants mentioned how difficult it is for them to navigate the mental health care system. Issues related to navigation include insurance, finding the right provider they connect with, and long wait times. Focus group participants often voiced their desire for a “one stop shop” that would help them navigate all these barriers. Currently, there is a pilot Navigator Role that is aimed at helping families navigate barriers when trying to access mental health care. Although it is a pilot position, the Navigator Role presents several opportunities for expansion and improvement.

Initial Action Steps:

  • Convene the Regional Youth Prevention Network and develop an updated and comprehensive job description of The Navigator to ensure this position is fulfilled by a highly skilled candidate.
  • Establish standardized data collection methods to facilitate data-informed decisions in the future.

Recommendation #2: Create supports for parents and youth to navigate the mental health care system

Provide support for parents navigating the mental health care system

Action Steps:

  1. Expand the current navigator role to include additional positions that are responsible for the following tasks:
      • Comprehensive case management (including next steps, follow-up, check-ins etc.)
      • Intake and triage
      • Ensuring warm hand offs
  2. Convene all navigators or people in similar roles within the region to create a Learning Community
  3. The Regional Youth Prevention Network should convene all appropriate stakeholders to develop an updated and comprehensive job description to ensure this position is fulfilled by a highly skilled candidate.
  4. The navigator should have access to updated information about provider availability and insurance information, community-based programs, specialty programs, alternative schooling programs, inpatient programs, etc.
  5. Establish a standardized way for the Navigator to collect demographic data from parents and youth (e.g., insurance provider, type of services they are looking for, age, municipality, etc.), provider information (e.g., referral processes, insurance information) to facilitate data-informed decisions in the future.
      • Utilize data to conduct continuous quality improvement efforts such as improving process in how Navigator handles referrals from start to finish, identifying which providers that might need to be removed from list, etc.
      • See Navigator survey results for more information
  6. Work with the Regional Youth Prevention Network and school districts to continue to promote the Navigator position as a resource for families.
  7. Put this information on a website where parents and youth can see waitlist time updated in real time.

Why?

A prominent theme from the focus groups was the difficulty parents faced in trying to obtain care for their child.

Facilitate a space for parents and youth to connect and organize around their challenges and experiences
capeann4

System Coordination

Model: The Regional Youth Prevention Network

Continuity of care was a key component that focus group participants cited was lacking from their mental health care experiences. They often mentioned that the health care system felt disjointed, with minimal support for patients in ensuring sustainable and comprehensive care.

The Regional Providers Network convenes providers, lending itself to coordination and communication amongst providers in the area. This Network can be bolstered to enhance their authority and tap into their knowledge and potential.

Initial Action Steps:  

  • Develop 5-year Goal for Network
  • Schedule bi-monthly meetings for the Network

For more action steps, click here for Recommendation 3.

Recommendation #3: Formalize comprehensive collaboration and communication within the mental health care space

Continue to expand and improve on the Regional Youth Prevention Network

Action Steps:

  1. Regular convenings for the Network to provide formal and informal opportunities for people to connect and learn
  2. Establish a collaborative workplan/agenda that the Provider Network would like to achieve on a yearly basis
  3. Regular assessment to determine if the appropriate partners are at the table
Create a system to unite disjointed settings and providers
capeannrep

Provider Network

Model: Children’s Friend and Family

High turnover of clinicians and providers and long wait times were often the root of frustration for parents, youth, and key informants. Parents and youth shared how frustrating it is to form a trusting relationship with a provider or clinician only for them to leave. Key informants also noted that due to high turnover, it creates gaps in continuity of care and a repetitive cycle of staff needing to build trust with cohorts of students.

According to key informant interviews, some community based organizations, such as Children’s Friend and Family, have remained consistently successful in retaining providers and clinicians. This presents opportunities for learning and regional collaboration on how to increase and retain the number of providers in all settings.

Initial Action Steps: 

  • Conduct research with outpatient clinicians (both in private and community-based settings) to determine what could help with retention, reduce turnover, and onboard new clinicians.
  • Backed by findings and research, develop a local policy agenda to advocate for change at state level

For more action steps, click here for Recommendation 4.

Recommendation #4: Increase the number of providers in all settings

Increase the number of providers in all mental health care settings because one of the most prevalent barriers to mental health care was long wait times

Action Steps:

  1. Incentivize outpatient clinicians to work in the North Shore (e.g., subsidy for student loans to attract more people into the field)
      • Actively recruit bilingual and multicultural clinicians
  2. Conduct research with outpatient clinicians (both in private and community-based settings) to determine what could help with retention, reduce turnover, and onboard new clinicians.
      • Backed by findings and research, develop a local policy agenda to advocate for change at state level
  3. Implement more sustainable funding mechanisms and billing
      • Establish reimbursement rates that ensure mental health and substance use providers to ensure participation with health plans
  4. Engage in conversations with local pediatric doctor’s office to explore implementing team-based care, including community-based supports.
  5. Promote effective use of technology to increase accessibility of the current available providers.
  6. Develop career ladders and opportunities for new clinicians and providers, peer mentorship programs, specifically for individuals already in communities
capeann6

Literacy

Model: North Suffolk Public Health Behavioral Health Working group

Promoting mental health literacy to the general population emerged as a key recommendation in order to reduce the frequently mentioned themes of stigma and negative perceptions of mental health. While a local model did not emerge in the research, there are many agencies and organizations within the region that have the influence and authority to promote and normalize a more modern and less antiquated view of mental health issues. For example, the Behavioral Health Working Group from the North Suffolk Public Health Collaborative, recruited and trained youth to deploy a social media campaign aimed at reducing stigma around mental health within the community. This model can be applied to the North Shore/Cape Ann Communities since the foundation is already in place (I.E. The Youth Leadership Council).

Initial Action Steps:  

  • Mobilize the youth leadership council to create social media campaigns to promote a normalized and holistic concept of what mental health constitutes, including culturally appropriate media and outreach campaigns targeted at immigrant families.
  • Conduct regular outreach campaigns within schools to promote and encourage that all the services provided by a school-based clinician, adjustment counselor, school resource officer, etc. are available to students, irrespective of severity of mental health issues.

(Also see Recommendation #1, above)

Recommendation #5: Promote mental health literacy to the general population to reduce stigma and improve perceptions of mental health

Promote and normalize a more modern and less antiquated view of mental health issues

Action Steps:

  1. Mobilize the youth leadership council to create social media campaigns to promote a normalized and holistic concept of what mental health constitutes.
      • Develop culturally appropriate media and outreach campaigns targeted at immigrant families
  2. Conduct regular outreach campaigns within schools to promote and encourage that all the services provided by a school-based clinician, adjustment counselor, school resource officer, etc. are available to students, irrespective of severity of mental health issues.
  3. Promote and advertise more holistic examples of self-care
Combat cultural fear and stigma

Appendix

Navigator Survey Results  

GHD is currently piloting a Mental Health Navigator position with support from an existing community-based organization. The Mental Health Navigator assists parents and youth by connecting them with a mental health provider that accepts their insurance coverage. Additionally, the navigator works to ensure that the mental health provider is a good match for the parent or youth’s unique needs, and that the wait time is manageable. 

Since the start of this pilot position, the navigator has received a total of 52 referral requests. Referral requests the navigator received were often from parents calling on behalf of their child or parents calling after being referred from an existing provider. The navigator has been able to refer everyone to at least one mental health provider fitting their needs; in some cases, they have been able to provide more than one option. Currently, the navigator works from a list of 53 mental health providers that are located throughout Cape Ann and North Shore communities, primarily Beverly, Danvers, Gloucester, Ipswich, Manchester by the Sea, Peabody, Salem, and South Hamilton.  

Based on data collected by the navigator, of the 53 mental health providers that the navigator utilizes, 63% of providers accept some form of public insurance or private insurance and 47% of providers accept both public and private insurance. Tufts Public Health Plan (MassHealth) is the most accepted public insurance option, and Blue Cross Blue Shield is the most accepted private insurance option.  

Post-Focus Group Survey Results  
Key Informant Interviews with School Officials

1 E. McCance-Katz & C. Lynch. Guidance to States and School Systems on Addressing Mental Health and Substance Use Issues in Schools. SAMHAS. July 1 2019.

Continue reading...

COVID-19 Layoff Housing Gap Update: The Crisis Continues

3599611
COVID-19 Layoff Housing Gap Update: The Crisis Continues

The COVID-19 Layoff Housing Gap

October Update: The Crisis Continues

Published Monday, October 5, 2020

This is an update to MAPC’s “The COVID-19 Layoff Housing Gap” report. Read the full report and see a listing of other updates here.

This research brief continues MAPC’s efforts to track COVID-19 unemployment and associated housing insecurity in Massachusetts. Since March, we have been tracking periodic reports on those who applied for, or received, unemployment assistance. Combining this data from state agencies and the U.S. Census Bureau, we estimate the number of households affected by unemployment, whether they will be able to cover both rent and other basic expenses with their remaining income, and if not, what the monthly gap is. This update provides new information from unemployment filings for the week ending September 5 (the most recent data available) as well as data collected through the Census Bureau’s biweekly Pulse survey conducted September 2 to September 14.


Key Findings

  • Over 330,000 Massachusetts workers—about one in 10are receiving standard unemployment assistance as of September 5. The number of claimants and rate of unemployment has been declining since June, but our unemployment rate remains among the highest in the nation. CARES Act stimulus payments, expanded unemployment, and supplemental federal assistance from FEMA have all expired. Those who are able to access standard unemployment or Pandemic Unemployment Assistance (PUA) receive only half their weekly wages, up to $823
  • We estimate that 45,000 renter households and 35,000 owner households with a worker on standard unemployment assistance will have trouble covering their housing costs and basic needs this month. The housing gap for rental households could exceed $40 million in October alone. We also know that tens of thousands of other households are also in trouble, although their numbers are more difficult to estimate. This includes people receiving PUA, undocumented workers who can’t apply for unemployment at all, workers with reduced hours and wages, and households who are working again but owe back rent. The Census Bureau Pulse survey indicates that nearly one in six renters in Massachusetts are already behind on their rent payments and one in five were not confident they could pay October rent. An estimated 60,000 Massachusetts renter households fear imminent eviction.
  • While state and local leaders have increased the amount of emergency rental assistance, it remains insufficient to cover the need. Without federal, state, or court intervention, Massachusetts is likely to see a significant wave of evictions and foreclosures in the coming months. As a result, more people may find themselves homeless or living in overcrowded housingcircumstances that contribute to the spread of COVID-19 and may extend the length of the pandemic. Small landlords unable to cover mortgage payments due to lost rent may be forced to sell their rental properties, accelerating the consolidation of the rental real estate market under the control of large corporate owners and trusts.  

Unemployment and Rental Housing Insecurity Estimates

According to the Executive Office of Labor and Workforce Development, 334,200 Massachusetts workers filed continued unemployment claims for the week ending September 51. This figure is equivalent to about 9.4% of the total Massachusetts labor force of approximately 3.5 million workers in August 2020. Unemployment—both in terms of rate and number of those out of work—is higher than any time since the 1970s. The official August unemployment rate of 11.3% is seventh highest in the nation.

Fortunately, the number of claimants and the unemployment rate have been on the decline since June. The number of claimants has dropped 27% since the week of July 18, the period covered by MAPC’s previous report in this series. Still, new workers are laid off each week: 18,000 workers filed initial unemployment claims in the week ending September 5.  

While the number of claimants is on the decline, the amount of assistance they are receiving has also shrunk: one-time CARES Act stimulus payments were delivered five months ago; the $600 per week expansion of standard unemployment assistance expired on July 25; and FEMA’s supplemental Lost Wages Assistance (LWA) of $300 per week lasted only six weeks, concluding on September 5. As a result, claimants now receive the standard unemployment benefit of half their weekly wages, up to a maximum of $823 

Based on information about the affected occupations of claimants (described in prior reports), we estimate that 125,000 of the claims filed during the week ending on September 5 were filed by workers in renter households (37.4% of all claims). Based on these claims, we estimate 45,000 renter households will not have enough income remaining to cover the cost of both housing and basic needs2. While the number of households in trouble has declined since July, there is still a massive deficit for renters: the average gap between available income and housing costs is $940 per month, or $42.3 million in October alone for those on unemployment in September. While some may still have savings to dip into, others will also be carrying rent debt from prior months.   

This estimate is surely just a fraction of the total need, as many affected workers and households are harder to estimate. For example, self-employed, contract, and seasonal workers are eligible to receive PUA, which provides benefits comparable to standard unemployment, but only through the end of this calendar year. While detailed count and occupation data are not available for PUA recipients, we can make general estimates. Based on cumulative claims since March, there are about six PUA recipients for every ten standard unemployment claims. This factor suggests more than 200,000 continuing PUA claims for the week ending September 5. We don’t have the information necessary to estimate how many of these workers will have trouble paying rent, but it’s likely that tens of thousands of households are at risk.

Undocumented workers are also not included in our estimates because they are ineligible to receive either standard unemployment or PUA. As described in previous reports, it’s estimated that approximately 200,000 workers in Massachusetts are undocumented. While their unemployment rate can’t be known, it’s likely much higher than the general labor force. It’s likely that over 40,000 undocumented workers lost their jobs during the pandemic but are not captured in the unemployment claims data. We estimate that these workers occupy approximately 25,000 households highly vulnerable to both eviction and COVID.   

Also not accounted for in our estimates are workers who for one reason or another haven’t been able to access their unemployment benefits, workers with reduced hours and wages (but no unemployment benefits), and workers who are back on the job but don’t earn enough to cover past rent and overdue bills.   

Homeowners also face challenges

MAPC estimates that 35,200 homeowners with an unemployed person in their household will likely have trouble covering their housing costs, with a total available income-expense gap of $44 million per month. These households now face increasing risk. During the eviction moratorium, missed mortgage payments were deferred to the end of the loan term, so owners have not been accumulating past due bills. When the moratorium expires, those who cannot keep up with their payments could start to fall behind on their mortgage. With the limited for-sale inventory and sky-high prices, banks and lending institutions could feel strong incentives to initiate foreclosure proceedings.

While comprehensive estimates aren’t feasible due to lack of data, there is other evidence that our unemployment claim-based estimates are just a fraction of the total need. The U.S. Census Bureau’s Pulse survey, administered over the internet since late April, provides almost real-time information about how residents are handling the COVID crisis3. For the period from September 2 to September 14, the Pulse survey reports that 16% of renters reported being currently caught up on rent payments, and 6% of renters thought it was somewhat or “very likely they would have to leave this home in the next two months because of eviction. With approximately one million renter households in Massachusetts, this suggests that approximately 160,000 renter households currently owe back rent, and 60,000 of those fear imminent eviction4. Many renters also said that they anticipate having trouble paying rent in the coming months: 8% said they had “no confidence” they would be able to pay October rent on time, and an additional 14% said they had only “slight confidence” for an on-time payment. All told, more than 200,000 households were not sure they could cover their October rent 

Implications of Our Findings

The scale of the potential rental housing crisis is enormous: without significant intervention, its impacts could be devastating. First and foremost, housing instability will worsen the COVID-19 pandemic. There is a strong public health rationale for the eviction moratorium, since protected households are, as a group, more vulnerable to COVID-19. In previous reports, we demonstrated that at-risk renter households are disproportionately likely to include children, people who speak a language other than English at home, and workers of color. According to the Centers for Disease Control and Prevention, all of these characteristics are associated with higher rates of coronavirus infection5. Families experiencing housing instability are also more likely to have underlying health conditions associated with higher rates of morbidity and mortality due to COVID-19. A survey6 of over 22,000 families found that those who had not been able to pay the rent on time in the prior year were more likely to report fair or poor health, childhood hospitalizations, food insecurity, and health cost sacrifices.  

If these at-risk households were to lose the protection of the eviction moratorium, it is highly unlikely that they would be able to find suitable alternative housing that they could afford. The rental vacancy rate in Massachusetts was only 3.6% in 2019, the lowest it has been since 20027. According to the US Department of Housing and Urban Development8, the Boston Metro Region (containing more than two-thirds of the state’s population) is the third most expensive market in the country, and average rents are more than $2,000 per month. While there are signs that vacancy rates in Greater Boston are ticking upwards and rents are falling slightly, the effect has been seen primarily seen in high-end units in areas such as the Seaport and Back Bay, not in other municipalities and neighborhoods that remain too expensive for most families.9 In such an inflated housing market, it is likely that any household evicted due to inability to pay rent for a COVID-related reason would either become homeless or move in with another family or household, very likely creating overcrowded conditions. Both homelessness and overcrowding are also major risk factors for contracting and spreading the novel coronavirus10. 

The long-term economic impacts of widespread evictions could be profound. Eviction and relocation are costly for tenants. An eviction judgement can have permanent negative effect on credit scores, making it harder for those who were evicted to find another apartment, borrow money for education, or purchase their own home. The crisis may also be very costly for landlords, and may particularly stress those with limited financial reserves. The moratorium has already shifted some of the financial burden of the pandemic to property owners, who will have little chance of collecting past due rent even if they successfully pursue eviction. Delays in finding new tenants could exacerbate income losses for small landlords.  

Over the long-term, this process could exacerbate underlying factors contributing to the state’s decline of “naturally affordable rental housing, which is most commonly found in mid-sized properties owned by individual property owners. Loss of rental income could result in cash flow shortages for landlords, especially those who own only one or a few properties. Those most hard-hit could be forced to sell their rental assets in order to stay afloat. This process could accelerate consolidation of the rental real estate market under the control of large institutional owners and investors. A recent publication from the Harvard Joint Center for Housing Studies11 reported that the share of rental units owned by institutional owners such as LLCs, LLPs, and REITs grew substantially between 2001 and 2015. The report continues: “Meanwhile, individual ownership fell across rental properties of all sizes, but especially among buildings with 5–24 units. Indeed, the share of mid-sized apartment properties owned by individuals dropped from nearly two-thirds in 2001 to about two-fifths in 2015. Given that units in these structures are generally older and have relatively low rents, institutional investors may consider them prime candidates for purchase and upgrading. These changes in ownership have thus helped to keep rents on the climb.To the extent that the pandemic and associated fiscal strains hasten this shift from individual to institutional ownership, they could result in long-term declines in the stock of locally-owned, modestly priced rentals.  

Shortcomings of the Federal Eviction Moratorium

A federal eviction moratorium, issued by the Centers for Disease Control, took effect on September 5 and lasts until December 31, 2020. While this moratorium provides protection for many renters, it is less comprehensive than the state moratorium. For example, the Massachusetts moratorium allows essential evictions only in cases where tenants’ actions threaten the health or safety of others; whereas the federal moratorium allows evictions to be initiated for violation of “any contractual obligation other than the timely payment of rent, late fees, penalties, or interest.12 This loophole could provide a limited number of unscrupulous landlords with a mechanism to evict past-due tenants on pretense of noise or other trivial lease violations. This could be especially true in hot market where landlords might be interested in selling their buildings. 

The CDC requires all tenants seeking protection to submit a written declaration, using a federal form, “under penalty of perjury.This requirement will undoubtedly deter undocumented immigrants and possibly others from availing themselves of the benefit of the moratorium. Furthermore, the Massachusetts moratorium also provides relief from late fees and credit reporting for tenants who submit the proper hardship notification to their landlords (though such notification is optional for tenants) 

Finally, the CDC moratorium states that landlords, except for essential evictions, may not “remove or cause the removal of a covered person from a residential property” during the period of the moratorium. It is not yet clear if the Massachusetts Housing Court will interpret this to include any notification or legal action (which are prohibited by the Massachusetts moratorium), or will read it to cover only physical removal. If the latter, it is possible that courts may allow landlords to file cases and seek judgements between October 17 and December 31. As a result, physical evictions could begin to take place as early as January 1, in the midst of the winter when it is probable that infection and hospitalization rates will rise significantly.  

Policy Solutions

While state and local leaders have increased the amount of emergency rental assistance, it remains insufficient to cover the need. Without federal, state, or court intervention, Massachusetts may see a significant wave of eviction filings in the courts beginning in late October, followed by physical evictions beginning in early January. As a result, more people may find themselves in overcrowded housing or homeless, circumstances that contribute to the spread of COVID-19 and may extend the length of the pandemic. Small landlords unable to cover mortgage payments due to lost rent may also face foreclosure or be forced to sell their rental properties, accelerating the consolidation of the rental real estate market under the control of large corporate owners.  

A comprehensive set of solutions are needed to help mitigate this impending crisis: significant rental assistance accompanied by outreach efforts, process streamlining, and support for implementing agencies; support and incentives that encourage landlords and tenants to negotiate a payment plan, rather than going to court; legal assistance for tenants at risk, in cases where a court case is unavoidable; and foreclosure protection for landlords at risk due to missed payments. Together, these solutions can help to keep Massachusetts residents in their homes and reduce the spread of COVID-19. However, it is not likely they can be put in place in the next two weeks before tenants lose the protection of the state eviction moratorium. Therefore, MAPC strongly recommends that the Baker Administration extend the moratorium to the end of the year, and that Housing Court declines to hear nonessential evictions in advance of December 31. These actions will provide the time needed for the state and advocates for tenants and landlords to develop and implement the solutions needed to meet this crisis.  

References

[1] While an EOLWD press release reports continuing claims of 387,829 for the week ending September 5, the data downloads available from the state used for this analysis total only 334,200 claims. We were unable to determine the source of the discrepancy.

[2] As described in prior reports, this analysis assumes basic expenses of $620 per month per person for food, medical care, auto ownership, and other ongoing expenses excluding housing and child care.

[3] https://www.census.gov/programs-surveys/household-pulse-survey.html

[4] These are very general estimates that apply shares from the Pulse survey to the most current household data. They do not account for the different universes for the two datatsets (adult renters vs renter households) nor do they account for the very small number of renter households who do not pay rent.

[5] https://www.cdc.gov/coronavirus/2019-ncov/need-extra-precautions/racial-ethnic-minorities.html

[6] Sandel et. al, Unstable Housing and Caregiver and Child Health in Renter Families; Pediatrics. February 2018, 141 (2) e20172199; DOI: https://doi.org/10.1542/peds.2017-2199

[7] https://fred.stlouisfed.org/series/MARVAC

[8] https://www.huduser.gov/portal/publications/pdf/BostonMA-CHMA.pdf

[9] https://www.bostonindicators.org/reports/report-website-pages/covid_indicators-x2/2020/september/renter-landlord-negotiations

[10] https://www.cdc.gov/coronavirus/2019-ncov/need-extra-precautions/racial-ethnic-minorities.html

[11] America’s Rental Housing 2020 https://www.jchs.harvard.edu/sites/default/files/Harvard_JCHS_Americas_Rental_Housing_2020.pdf

[12] https://www.federalregister.gov/documents/2020/09/04/2020-19654/temporary-halt-in-residential-evictions-to-prevent-the-further-spread-of-covid-19


Continue reading...

Unemployment Community and Regional Rapid Response Plan

Photo Credit: Jon Taylor
Unemployment Community and Regional Rapid Response Plan
A Community and Regional Rapid Response Plan

Significant Labor Force Disruptions and Unemployment

August 2020

The Coronavirus has drastically, and possibly permanently, altered traditional economic systems as we know them – in the MAPC region and across the globe. In partnership with organizations across the public, private, and nonprofit sectors, MAPC has worked to evaluate the immediate critical needs and options for unemployed individuals and to create an action framework for economic security. This action framework is structured around the concept of a networked response, one that distributes actions across a range of actors to collectively leverage available resources and tools, to the short- and long-term recovery efforts.

MAPC identified the following action steps to coordinate and leverage all possible resources:

  • Formalize communication systems between intergovernmental departments and outside organizations through codified MOU/MOAs
  • Identify and implement a shared technology that enabled quick and responsive inter-agency organization and communication
  • Expand the network of stakeholders currently involved in this work to include representatives from community-based organizations (CBOs), businesses, anchor institutions, transportation providers, public health departments, and others as needed
  • Create targeted outreach materials for residents seeking social services and businesses seeking reopening information
  • Coordinate efforts between public health departments, inflectional services departments, workforce providers, employee advocacy organizations, businesses, and economic development actors to ensure that businesses can open safely and smoothly in line with the state’s reopening plan
  • Create a unified intake system for social service assistance that can be used to document trends in need and populations who may need additional outreach
  • Continue to advocate for update municipal-level unemployment data
Continue reading...

City of Quincy Small Business Plan

FatCat_Corridor_Lighting_Quincy
City of Quincy Small Business Plan

March 2020

Quincy Small Business Plan

The Quincy Small Business Plan intends to provide a comprehensive understanding of the small business landscape and its strengths, gaps and opportunities in Quincy. The Plan includes recommendations of how the City of Quincy and its partners, such as the Chamber of Commerce, can fill some of these gaps and provide ample opportunity for the small business community to continue to thrive in Quincy.

Key Needs:

  • Business growth through new customer revenue
  • Attracting new customers through increased marketing
  • Adding products and services to attract new clients
  • Customer retention, particularly in light of increased competition, rising costs
  • Financial management, to better manage operations, price competitively and wisely, and reduce expenses
  • Expense reduction through health care and other insurance assistance
  • Employee recruitment and hiring
  • Succession planning, for those business owners seeking to retire
  • Visual merchandising, to improve the attractiveness and effectiveness of store layouts and displays
  • Location assistance, both finding an appropriate location and lease negotiations
  • District-wide/citywide marketing to highlight the city’s small businesses
  • District amenity support to enhance the customer experience (parking, streetscape improvements)
  • Assistance navigating City processes (licensing/permitting)

Recommendations:

Recommendations detailed in the plan include:

  • Translation/interpretation for City services
  • Workshops
  • One-on-one assistance
  • Storefront improvement/facade improvement program
  • Referrals to local resources
  • Grants for businesses
  • Netweorking events
  • Citywide marketing
  • Parking and wayfinding
  • Outreach
  • Emergency response
Continue reading...

Building a New Future Together

small business
Building a New Future Together

Building a New Future Together

How Municipal Governments Can Help Their Small Businesses to Reopen, Recover, and Thrive

May 2020

MAPC’s “Building a New Future Together,” released on May 12, 2020, contains recommendations for how municipalities can facilitate small business reopening and recovery.

These businesses are critical to local economies and they face significant challenges in being able to survive past the early phases of the COVID-19 crisis. Neighborhood businesses are particularly vital in some of our hardest hit communities, and if we help them to move beyond the current crisis, they can serve as the backbone of neighborhood revitalization.

Municipal government has a key role to play in helping small business to reopen, recover, and thrive well into the future. However, the Commonwealth must provide clear, consistent guidelines and requirements, and to ensure consistent messaging to business owners, employees, and customers about how to remain safe after reopening occurs. The state can also play a key role in providing access to testing and PPE, as well as support for the increased enforcement needed to ensure compliance.

Throughout the phases of reopening and recovery, municipalities will need to be entrepreneurial and flexible according to changing needs and conditions of small businesses in their community. In each city or town, these recommendations can help to guide the development and implementation of a plan for each municipality, but always with the involvement and input of the communities being served, and with cultural awareness and sensitivity.

In July 2020, MAPC published a small business support plan for the Town of Arlington, Cities of Medford and Salem, and Newton-Needham Chamber of Commerce. Click here to learn more.

Continue reading...

Newton Climate Vulnerability and Action Plan

Newton MVP Workshop

MAPC

Promoting Smart Growth & Regional Planning

DECEMBER 2018

City of Newton Climate Change Vulnerability Assessment and Action Plan

We can take steps to increase Newton’s resilience and limit future damages from climate change. Many of today’s investments and decisions in the City of Newton have long legacies that will influence future vulnerabilities. Of particular concern are the impacts on vulnerable populations in Newton including seniors, individuals living alone, people with a disability, young children, people who are socially isolated, and people with limited English language proficiency.

Advance planning can save money, while inaction, or actions that don’t anticipate future conditions, may lead to higher costs in the future. An example of effective planning comes from the reports that Florida properties experienced much less damage from Hurricane Irma in 2017 than from Hurricane Andrew in 1992. This is attributed to critical improvements made to the building code because of lessons learned from Hurricane Andrew.

This report identifies future climate vulnerabilities and suggests strategies for the City of Newton that can reduce the risk of harm to people, properties, and natural resources and help speed recovery when inevitable future storms occur. The recommendations span many areas and range from easy and quick to difficult and expensive. They include such areas as:

  • Communicating with and supporting vulnerable populations
  • Improving stormwater systems and restoring natural drainage
  • Planting more trees
  • Continuing and improving emergency preparedness
  • Investing in critical infrastructure (e.g. bridges and culverts)
  • Incorporating green infrastructure and stormwater management into the zoning ordinances as they are revised.
Continue reading...