Top

Cambridge Arts for Health

Cambridge Arts for Health

MAPC’s Arts and Culture, Public Health, and Community Engagement teams are partnering with Cambridge’s Public Health Department to  use art to engage residents around the city’s Community Health Implementation Plan (CHIP).

The city is partnering with artists to create creative, safe, accessible and culturally inclusive opportunities for residents to learn about the plan’s three priority areasCommunity and Social Resilience, Healthy Eating and Active Living, and Mental Health, with a cross-cutting emphasis on health and racial equity.

Our Artists

A series of performances took place in fall 2021.

Isaura de Oliveira and Akili James brought performances to the Port involving live music, dance, audience interaction, video, games and informal conversation in the spirit of a special Brazilian celebration called “Mesa de Caboclo.” They invited participants into gentle movement, game show- style health trivia, and informal conversations.

Yosi Karahashi offered three flamenco performances to older adults in Cambridge. At these free events, participants experienced “a moment full of joy” by making music of their own through rhythmic clapping, footwork, and body movements. A video with additional lessons was shared with participants to practice at home. Performances took place at Neville Place, The Cambridge Homes, and the Citywide Senior Center in October and November.

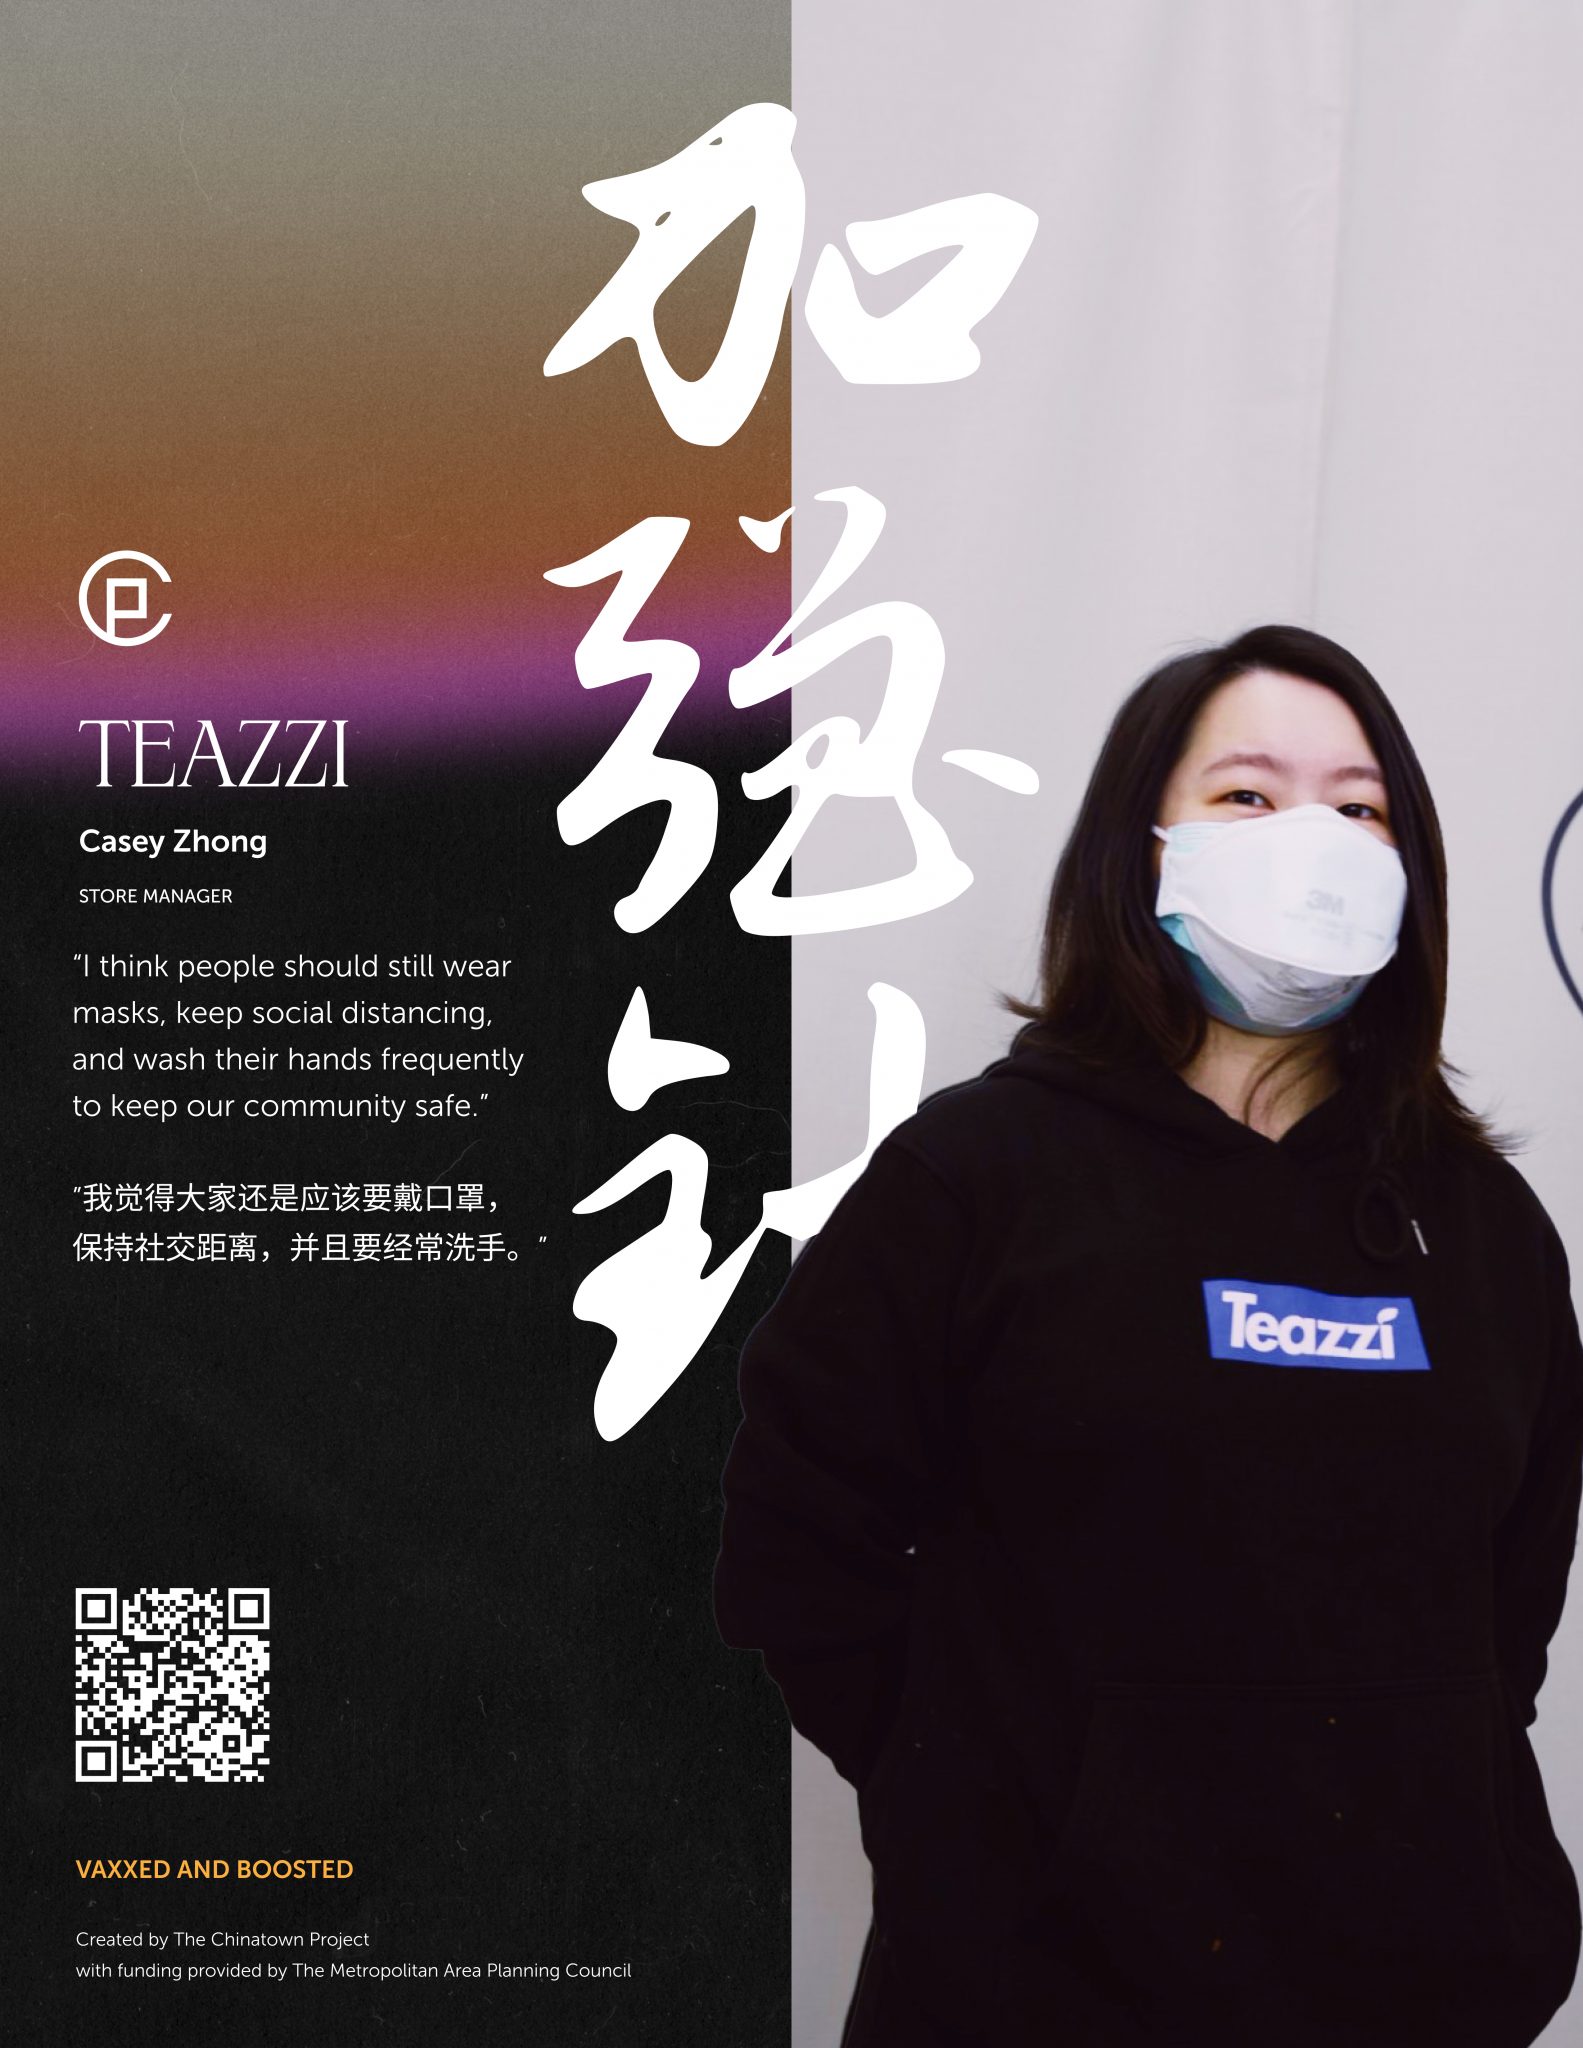
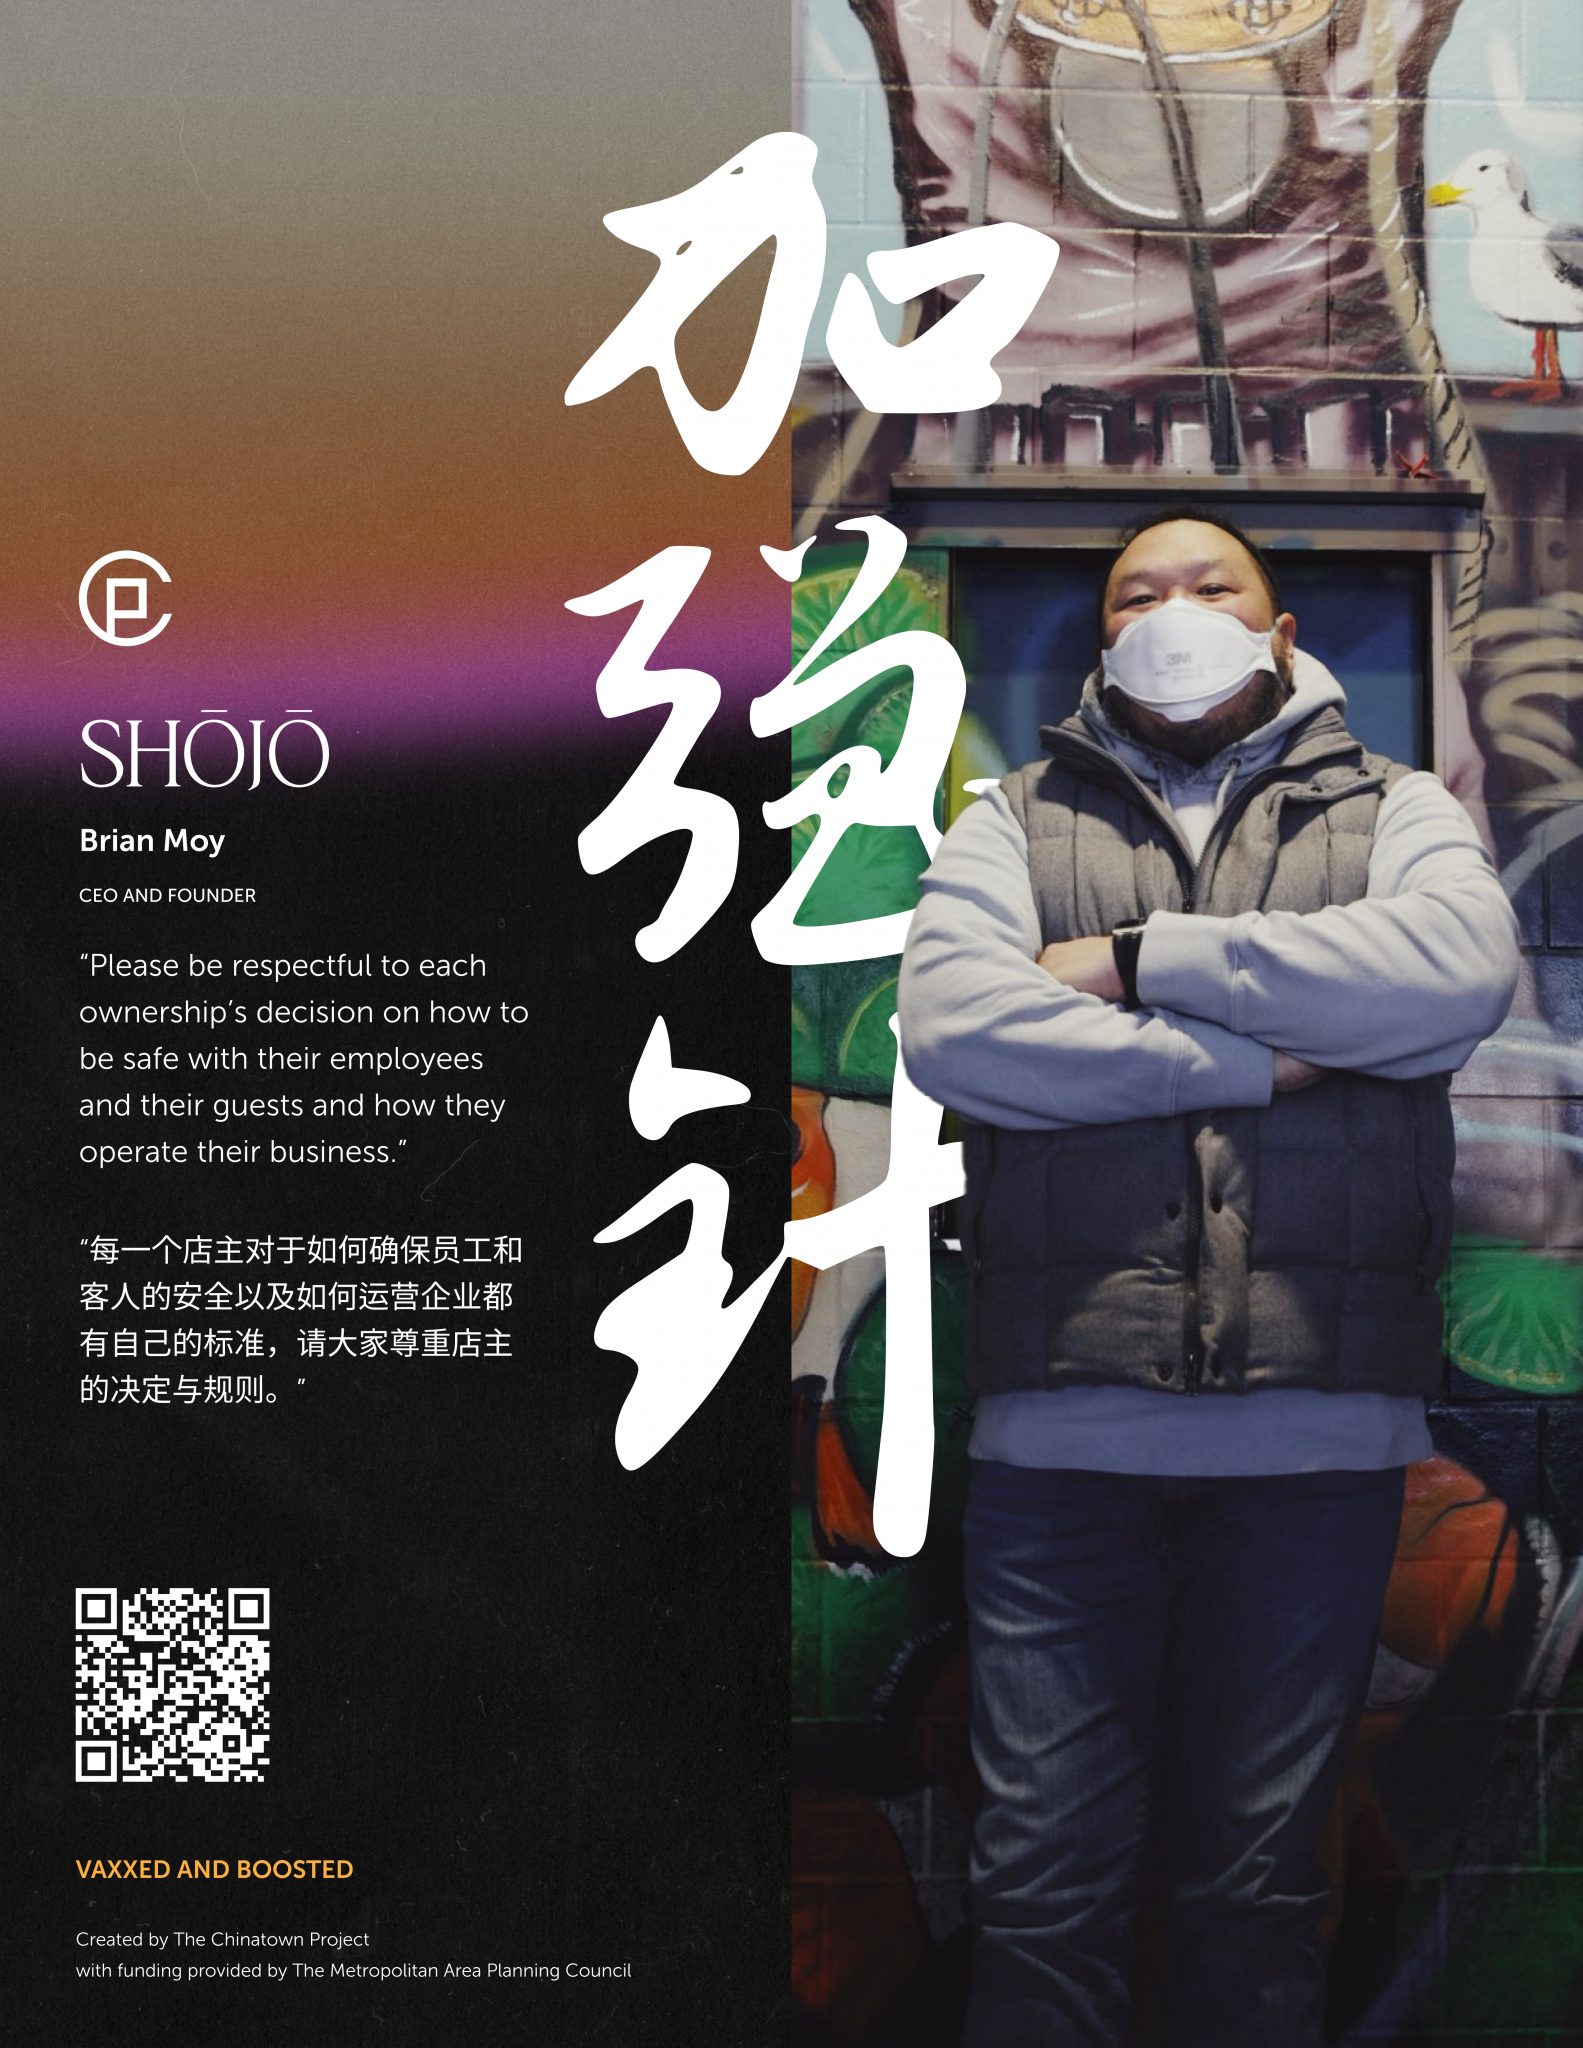
Yung-Chi Sung shared the practice of Chinese calligraphy and Tai Chi through a series of online and in-person workshops. In the face-to-face workshops, participants used their arms and body as the brush pen to write Chinese characters and practice Tai Chi. Online workshops taught participants calligraphy and appreciation of the Chinese language, writing, and culture.

Project Context

Being a healthy city is about more than delivering quality health care to residents.  Where you live, learn, work, and play all have an enormous impact on your health. 

The Cambridge Public Health Department (CPHD) continues work to better understand the health needs of the community and develop programs and policies to address these needs. 

Healthy City Logo

Being a healthy city is about more than delivering quality health care to residents.  Where you live, learn, work, and play all have an enormous impact on your health. 

The Cambridge Public Health Department (CPHD) continues work to better understand the health needs of the community and develop programs and policies to address these needs. 

In December 2019, the CPHD completed its most recent iteration of the Community Health Assessment. The assessment reflects the most current data available for Cambridge on overweight and obesity, substance abuse, chronic illness, access to health care, and many other health topics. The report also looks at social, economic, and environmental issues that impact health. To read the complete report, click here. 

The Community Health Implementation Plan (CHIP) addresses the most challenging public health issues facing Cambridge, as identified by the CHA. These priorities have been identified as: 
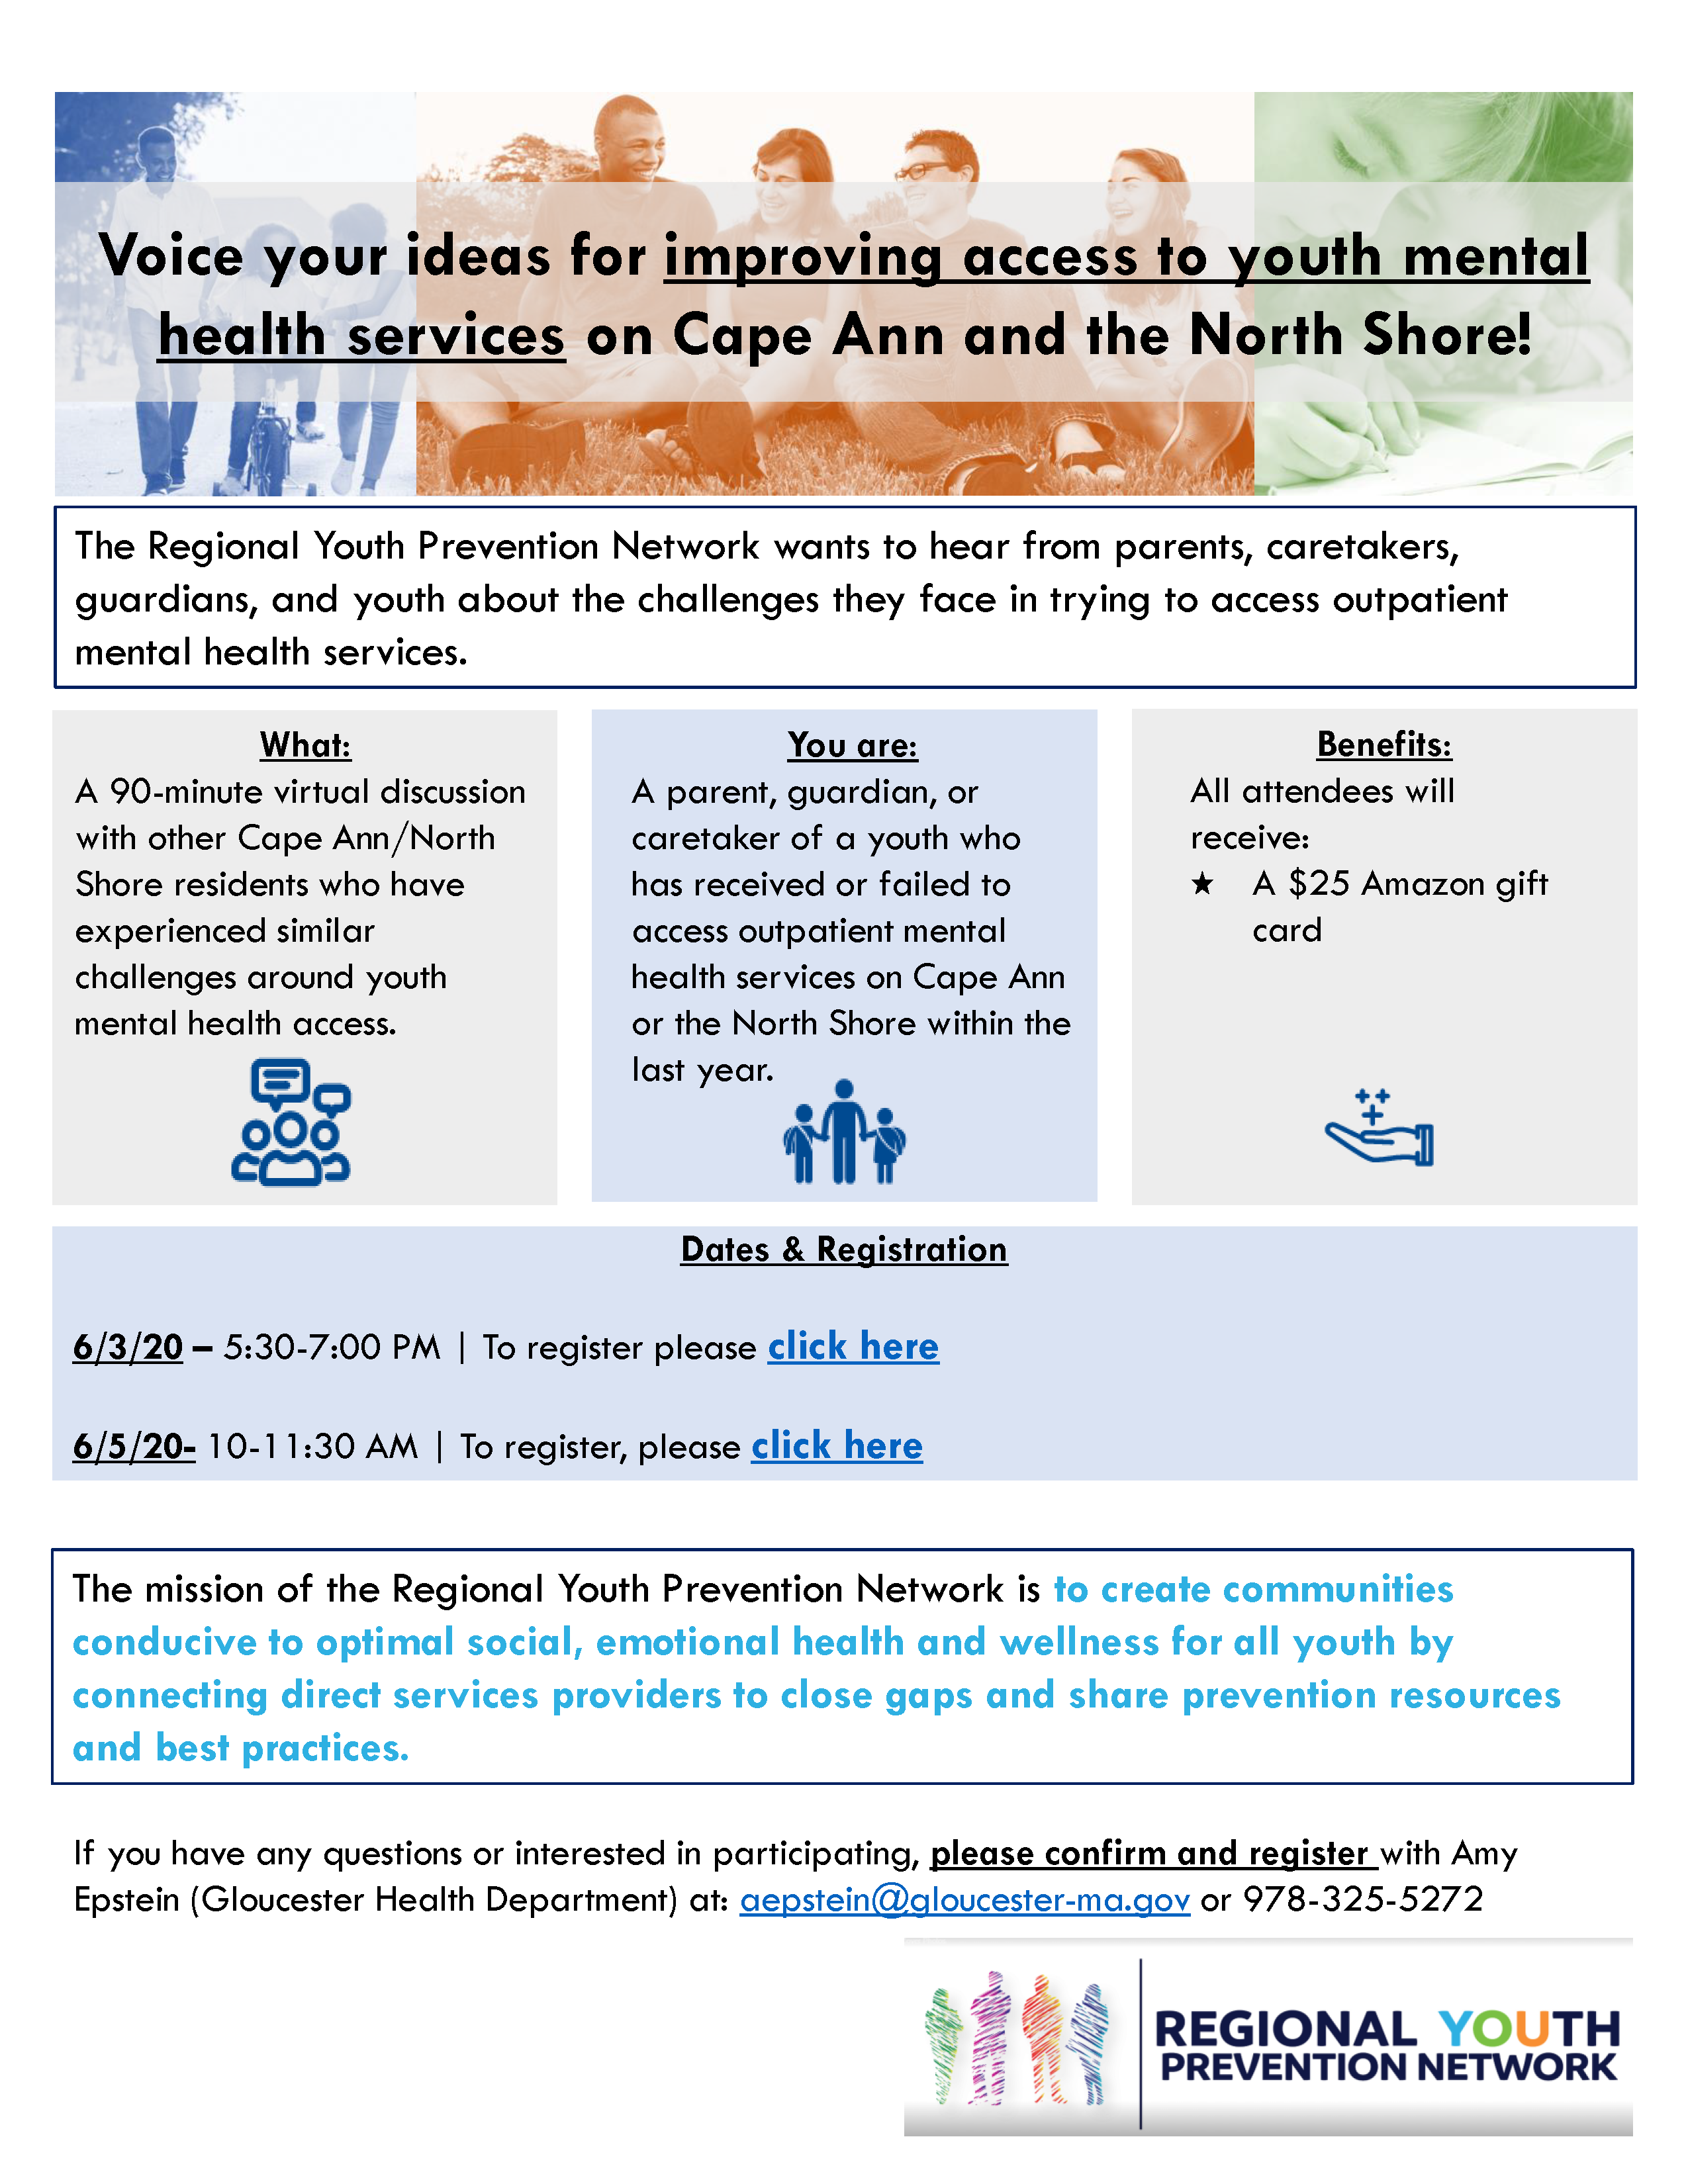
  • Mental health  
  • Community and Social Resilience 
  • Healthy eating and physical activity 

Each integrates a theme of health equity and racism and is receiving the attention of a dedicated working group.  

To learn more about the assessment and improvement plan, and to see how to get involved, please visit the Cambridge Public Health Department’s website. 

The 2021 Community Health Implementation Plan

The 2021 CHIP provides actionable goals, objectives, and strategies for making tangible progress in three health priority areas for the city 

MAPC

Over the five-year period of the CHIP, MAPC will be working with the City of Cambridge’s Public Health Department to support engagement with residents and organizations and assist with evaluation of CHIP implementation.  

Call for Artists: May to June 2021

MAPC and the Cambridge Public Health Department (CPHD) released the Call for Art on Tuesday, May 18, 2021. The deadline to apply was June 8, 2021.

The Call sought artists, designers, and creatives propose creative frameworks for community engagement around public health in the media of their choice.

Continue reading...

Creative COVID-19 Communications

final_60df3e8e70d72c00dcc0e210_776994
Creative COVID-19 Communications

Cambridge Arts for Health

Free-to-use graphics, videos, and more! Download the resources below and use them to encourage COVID-19 vaccination in your community. Artists appreciate credit, but it’s not required to use!

Get Vaccinated!

Looking for more information about getting your COVID-19 vaccine?

MAPC’s Arts and Culture, Public Health, and Community Engagement teams are partnering with Cambridge’s Public Health Department to  use art to engage residents around the city’s Community Health Implementation Plan (CHIP).

The city is partnering with artists to create creative, safe, accessible and culturally inclusive opportunities for residents to learn about the plan’s three priority areasCommunity and Social Resilience, Healthy Eating and Active Living, and Mental Health, with a cross-cutting emphasis on health and racial equity.

These artworks were commissioned by the Metropolitan Area Planning Council for public use and funded in part by the Barr Foundation.

How to Use These Resources

The graphics, videos, photos, and materials below are free to use. Download them in different formats by clicking the associated links. Materials are sorted by artist.

Have any questions? Would you like these materials in a different format? Are you a local public health provider or community-based organization seeking access to print versions of these materials for physical distribution? Contact Elise Harmon at [email protected].

More Information

Chelvanaya Gabriel

Mensajes de Esperanza/
Messages of Hope

Type: Postcards with writing prompts, illustrations

Languages: Spanish and English

Inspired by story circles with Holyoke’s Puerto Rican/Afro-Caribbean communities, Chelvanaya Gabriel incorporated residents’ own words into postcard designs with prompts about COVID-19 and vaccination.

More From Chelvanaya Gabriel

Chinatown Project

The Chinatown Project

Type: Posters

Languages: Chinese and English

The Chinatown Project’s poster series appeared in storefronts across Chinatown and depicts local business owners talking about the importance of vaccinations and other COVID-19 health precautions.

The group’s series of posters in 2021 encouraged vaccination and masking. The 2022 update encourages booster shots and continued COVID safety.

More From the Chinatown Project

Elevated Thought

Because We Care/ Sleeve Up/
Manga Arrbia

Type: Posters and mural

Languages: English and Spanish

Mural: Sleeves Up/Manga Arriba, a mural depicting a woman rolling up her sleeve to get the COVID-19 vaccine, is located on a wall in the 316 Common Street Parking Lot in Lawrence, across the street from the Buckley Transportation Center.

Video: Short video with Lawrence community members describing their reasons for getting vaccinated, in English and Spanish.

Posters: Two poster designs in English and Spanish can be printed or shared online! Updated in 2022 to include N96 masks and encourage people to stay up-to-date on their COVID-19 vaccines.

Visit Elevated Thought's Lawrence Mural in the 316 Common Street parking lot!
Visit Elevated Thought’s Lawrence Mural in the 316 Common Street parking lot!

More From Elevated Thought

[English] Because We Care
[Spanish] Sleeve Up

Greater Boston Artist Collective

Our New Start

Type: Videos

Languages: English and Spanish

Available in English and Spanish with subtitles in both languages, “Our New Start” depicts people getting vaccinated at the Reggie Louis Center.

Krina Patel

For You. For Me. For All of Us.

Type: Illustrations, Graphics, Gif

Languages: Haitian Creole

Krina Patel worked with Boston’s Haitian American community to create a series of illustrations and a gif. In each illustration, she highlights a different member of the community, with the phrase “Mwen pran vaksen pou Covid-19. Eske ou pran li deja? Si non, mwen ankouraje-w pou-w pran li.” This translates to “I’ve already been vaccinated for COVID-19. Have you? If not, you should.”

More From Krina Patel

Logo

Lillian Lee/Empty Bamboo Girl

加油! Add Oil!

Type: Comics, social media graphics, posters, animated gifts, and web graphics

Languages: English and Chinese

Lillian Lee chose the Cantonese/Hong Kong slang 加油! Add Oil! to be the rallying cry for the community to get their vaccine and to stay safe. Her comics, animated gifs, prints, and web graphics are designed to connect to the Chinese immigrant community. Updated 2022.

More From Lillian Lee/Empty Bamboo Girl

Comics:

Graphics:

Rachel Domond

We Keep Us Safe

Type: Social media graphics, illustrations, social media, coloring sheets

Languages: English, Haitian Creole, Cape Verdean Creole, Spanish

Illustrations with the phrase “We Keep Us Safe” in multiple languages encourage mask-wearing and inspire audiences to follow public health advice to protect each other. Updated in 2022.

More From Rachel Domond

Shaina Lu

Safer Together

Type: Social media graphics, infographics, illustrations

Languages: English, Chinese (Simplified and Traditional), Haitian Creole, Korean, Portuguese, Spanish, and Vietnamese

Shaina Lu’s graphics were designed to appeal to her home community of Malden but are universally useful. The series of four images contain information about protecting the community, how to sign up for a vaccine, and vaccine side effects. Updated in 2022.

More From Shaina Lu

Tran Vu

Vaccine Activities, Images, & Infographics

Type: Social media graphics, infographics, postcards, stickers, illustrations

Languages: English and Vietnamese

Use this wide variety of images and activities to spread the word about vaccinations on social media and entertain people at vaccination sites! Updated in 2022.

Click the thumbnails to the right to expand and save to your computer!

Graphics include:

  • Safe at Home Bingo in English and Vietnamese
  • Vaccine Word Search (Click here for answer sheet)
  • Stickers
  • Infographics
  • Postcard
  • Stickers
  • Graphics for social media
Continue reading...

Quincy Asian-Owned Small Business Video-lets

Adaptation, Community, and Identity

The stories of three business owners in Quincy illuminate the city’s development as a center of Asian-American entrepreneurship and business development. Through a collaboration with filmmaker, Daphne Xu, the interviews shared by Jim Mei, Chris Yee, and Lorraine Tse, highlight the larger trends and context relevant to the ongoing challenges of accessing resources, lack of support, and the impacts of COVID-19 on the Asian-owned business community. Closed captioning is provided in both English and Chinese, we encourage you to enable this feature when viewing. Learn more about the project.

Asset 4@300x

Jim Mei

A photographer and hair stylist, Jim Mei had served Quincy’s community for twenty years when the pandemic hit.

Jim first moved from Brighton to Quincy to start Jim’s Hair Salon in 1990, and since then, the demographics of the city have changed rapidly. Since 1990, the Asian American population has increased 22% (US Census)leading to a strong and loyal customer base for Jim’s business to grow over the years. However during the COVID-19 pandemic, Jim – like other sole proprietors in the service industry – hastruggled to access sufficient financial relief. For sole proprietors like Jimclosing his doors for months and then re-opening at a reduced capacity presents difficult financial challenges. The Federal Paycheck Protection Program meant to support business owners like Jim has served only 38% of establishments in Quincy (MAPC August 2020)While the City of Quincy has distributed nearly $1 million in grants to 100 businesses, this only represents 3% of small businesses in Quincy and continued support will be necessary through the duration of this pandemic. Maintaining the strength of Quincy’s small business community requires strategies to ensure that Asian immigrant business owners connect to the supports and resources they need. 

Chris Yee

Chris brought his Lion Dance studio to Quincy from Lowell to connect with its strong Asian immigrant communityFaced with lost revenues and high rent, he has struggled to stay in Quincy. 

Unlike Jim Mei, Chris Yee is a newcomer to Quincy’s small business community, he brought his Hung Gar Kung Fu and Lion Academy from Lowell to Quincy in 2017Whereas the Asian immigrant community of Quincy grew alongside Jim’s business, newcomers like Chris had to find available space and build community connections. Each of Quincy’s small business districts have their own unique characteristics and dominating industriesThe North Quincy and Wollaston business districts are retail-oriented and home to the Asian immigrant entrepreneur community (source: City of Quincy’s Small Business Study, MAPC 2020)The southern portion of Quincy Center where Chris Yee previously rented space is dominated by professional services such as lawyers and real estate agents, and lacks visibility among the Asian immigrant customer base. The entire city has also seen rapidly increasing rent in the past decade with more investment in market-rate housing and public space which has, as a result, driven up rents for businessesmarket rent per square foot in Quincy has gone up 15% since 2010, making it hard for small business owners like Chris to pay rent. 

Asset 5@300x
Asset 6@300x

Lorraine Tse

CEO of Sunshine Travel Agency, Lorraine has expanded the Asian immigrant community’s access to travel opportunities and provided language services to the region.

Regional tourism has been one of the hardest hit industries during the COVID-19 outbreak. A combination of increased travel restrictions and closed borders for many international travelers have had a devastating impact on travel agency operators like Lorraine Tse and her company, Sunshine Travel Agency. On a recent webinar hosted by NBC10, the Greater Boston Convention and Visitors Bureau stated that Boston area hotels would be seeing an occupancy rate of around 28% this year, instead of the usual 75%. In response to this, Lorraine made a creative pivot to grocery delivery to keep her business running and her workers employed. In addition to a challenging economy, Lorraine also speaks to the increased xenophobia against the Asian community that has been present since COVID-19 first entered public perception in January 2020. The Stop AAPI Hate Reporting Center run by the Asian Pacific Policy and Planning Council has reported a significant increase in xenophobic incidents in Massachusetts in 2020 As one of the first individuals to support the region with translation and interpretation services, Lorraine has contributed to the region’s ability to serve its Asian immigrant community. There is a need now for those efforts to be met with a robust government effort to combat racism and xenophobia directly. 

Continue reading...

Net Zero Building Ordinances

Brightergy - JE Dunn Construction Project - 52 kW - Kansas City MO - 5(0)-cropped
Net Zero Building Ordinances
Clean Energy

Wayland’s Net Zero Building Policy

During 2018 and 2019, MAPC provided technical assistance to the Town of Wayland on their municipal buildings policy to advance net zero in their municipal facilities. MAPC worked with municipal staff and the Town’s Energy and Climate Committee to develop a suite of resources to assist with implementation of their new high performing / low-carbon building policy. This project was funded by a Planning Assistance Grant from the Massachusetts Executive Office of Energy and Environmental Affairs.

The Town of Wayland is a stable and progressive community. It is characterized by a legacy of civic engagement and a commitment to citizen self-governance, advised and supported by professional staff. Wayland has undertaken numerous planning and project efforts related to reducing greenhouse gas (GHG) emissions and fostering clean energy and sustainable development over the years, many in conjunction with MAPC.

Project Deliverables

Click the links to explore the final project deliverables developed by MAPC for this project with Wayland.

Download PDF

Wayland Town Meeting Article: Resolution Energy and Carbon Savings in Municipal Building Construction, Frequently Asked Questions, MAPC, April 2018

Download PDF

Wayland Energy and Carbon Savings RFP Text, MAPC, June 2018

Download PDF

Sample Language: Procurements for Low-Carbon Municipal Buildings, MAPC, July 2018

Download PDF

Recommendations for Wayland to Optimize and Advance High Performing Buildings, MAPC, June 2019

Continue reading...

Arts Indicators for an Equitable Recovery

Capitol Theater photo via Tim Pierce, Wikimedia CC BY 3.0
Arts Indicators for an Equitable Recovery
Revive copy2

Local Arts Indicators For An Equitable Recovery in the Region

Recommendations published February 2022

To help municipalities chart a path to response and recovery for local arts and cultural organizations, MAPC is working with four communities to document the impact of COVID-19 on:

  • artists, arts and culture organizations, and creative enterprises
  • events, programming, and activities that make arts and culture a foundation of civic life and social cohesion

MAPC is working with Arlington, Boston, Beverly, and Franklin to identify and amplify response strategies in their local arts and culture communities. Through the course of this project, we will collect data to measure the impact of COVID-19 and use that baseline data to establish metrics and tools to regularly assess the municipalities’ arts and culture sectors.

Questions?

Email Annis Sengupta at [email protected].

More from Arts & Culture

Interested in keeping up to date on this and other arts and culture news? Click here to join the MAPC’s Arts and Culture mailing list.

Municipal Arts and Culture Indicators Data (2016-2020)

MAPC aggregated data from a variety of sources to provide a snapshot of arts and culture in Massachusetts municipalities to track Covid impacts and recovery. Data provided in this Airtable are organized by tab in the following categories:

  • Context – demographics
  • Covid context – cases, vaccinations, revenue and wage loss
  • Strategy – municipal strategies to support arts and culture – funding, planning and policy
  • Access – opportunities to access arts and culture through public art and events as well as indicators of engagement and inclusion
  • Production – artists and organizations producing arts and culture
  • Financial impact – tax revenues, wages, and employment
Screenshot of REVIVE Arts Indicators database.

For More Information:
Please see our Indicators Data guidance document and the presentation given to Arlington, Beverly, Franklin, and Boston in May 2022.

Recommendations for an Equitable Arts and Culture Recovery

Across Arlington, Beverly, Boston, and Franklin, we heard similar concerns around keeping the arts sector active and artists employed  while also addressing cultural equity. Our recommendations are  grouped into categories and address both immediate needs and long-term recovery.

Our recommendations center around six topics:

  • Providing culturally-inclusive access
  • Fostering partnerships to increase capacity
  • Transparent and efficient permitting
  • Building municipal support capacity
  • Improving access to public outdoor venues
  • Clear and consistent public health protocols

Webinar

June 8, 2021

Staff from Franklin, Boston, Beverly, and Arlington discuss a path to response and recovery for artists and arts organizations. Watch for preliminary findings of our regional survey and a discussion on how to provide more outdoor cultural programming as a safe COVID-19 strategy.

Background

Across the region, arts and culture has been devastated by the COVID-19 pandemic. As communities struggle to contain the virus and meet basic community needs, the arts have become a path to hope and recovery. At the same time, artists and arts and cultural organizations themselves have experienced devastating losses of income and revenue and face an uncertain future.  

This project will quantify and document the current arts and culture economy and available programming in our partner cities and towns. This data, along with response strategies, will help arts organizations, municipalities, state agencies, and nonprofits recognize and respond to the the impact of COVID-19 on artists, arts organizations, and the local creative economy.

Impact on Local Artists

Over 600 artists and creative workers from Arlington, Beverly, Boston, and Franklin took our survey on how the COVID-19 pandemic impacted them.

We’ve compiled some of the results:

Artists are working from home with limited access to creative space.

59% of participants are working from home.

70% of participants have limited access to their creative space.

Artists are isolated, but finding more time for creative practice.

78% report that isolation and social distancing are having an impact on their practice and 41% report increased time for creative practice​.

However, some have lost most of their income from that practice

8% lost 85% or more of their creative income.

28% rely only on income from their creative practice.

Loss of income is putting some artists in crisis even as needs are increasing

6% of participants are unable to provide basic needs for their family.

29% of participants have increased responsibilities caring for dependents.

As artists work to shift their practice, they are looking for support.

23% are shifting their creative practice to outdoor spaces.

49% would like more opportunities to take their creative practices outdoors.


Technology has become an important tool for artists.

45% are moving their creative practice to virtual platforms.

55% are using technology for collaborations and to connect.

Artists would like to see more support from their municipalities

Only 16% of participants think their community is doing a good job supporting artists and creatives

What Artists are Saying

We need to develop basic guidelines for outdoor events that act to empower people to pursue outdoor performances rather than creating barriers. Having templates that can be used rather than making everyone create a plan themselves would help. 
– Survey Respondent

What Artists are Saying

We probably need to re-imagine many things. How much it cost to be a creative and own your own business and how much space cost. Also, how much our non-tech, non-biotech, non medical, non financial services contributions are valued in MA. We seem to want arts and culture but no one wants to actually pay for that.
 – Survey Respondent

Our Partners

Town of Arlington

arlington-ma_seal-1

City of Beverly

Seal_of_Beverly,_Massachusetts

City of Boston

boston-logo

Town of Franklin

franklin-seal
Continue reading...

Melrose Housing Production Plan

Asset 5@2x

The Melrose Housing Production Plan is a process to set the course for the future of housing in Melrose.

Sign up for updates here!

smart growth district 7

Final Plan

Read the final Housing Production Plan (updated February 2022).
Learn about housing need, factors affecting development, and recommendations for increasing housing production and affordability in Melrose over the next five years.

We thank you for sharing your input during the public comment period and for your participation during this entire planning process. Upon local adoption by the Melrose City Council and Planning Board, the HPP will be sent to DHCD for review and approval.

About the Plan

Asset 2

The City of Melrose is launching a community-driven planning process to create a vision for the future of the city’s housing and to address housing needs. The Housing Production Plan (HPP)  will assess housing need and demand, analyze constraints and opportunities for housing development, set goals to address housing needs, and recommend practical strategies to achieve those goals. Along the way, this planning process will convene a public conversation about housing and the role it plays in the Melrose community. The HPP will address housing holistically with a focus on affordability and equity. Melrose has partnered with the Metropolitan Area Planning Council (MAPC) to conduct the process and produce the plan.

The ultimate product of this process is a plan that meets the requirements of a Housing Production Plan, as defined by Massachusetts General Laws under Chapter 40B. The finished plan will be submitted to the City Council and the Planning Board for adoption. If they adopt the plan, the HPP will be submitted for approval by the state’s Department of Housing and Community Development. The planning process is funded by MAPC’s District Local Technical Assistance Program and by a state Community Compact Grant awarded to the City of Melrose.

The City of Melrose Office of Planning and Community Development is leading the HPP, with Planning Director Denise Gaffey and Senior Planner Lori Massa managing the process at the City. Emma Schnur Battaglia, Senior Housing and Land Use Planner, is managing the process at MAPC. Please direct any questions to [email protected] or [email protected].

Timeline

Fall 2020
Housing Needs Assessment and Goal Setting

Winter – Spring 2021
Development Constraints and Opportunities Analysis

Spring 2021
Strategy Development

Summer – Fall 2021
Plan Production

Winter 2022
Plan Release and Adoption

Public Engagement

The Melrose HPP will be responsive to the real housing needs of the Melrose community, and therefore public engagement is at the center of the planning process. Due to the uncertainty created by the COVID-19 crisis, this process will be primarily conducted virtually.

Advisory Committee

The City of Melrose has convened an Advisory Committee of residents and stakeholders to weigh in on the process and help the City produce a plan that reflects the community and can be implemented. Advisory Committee members are responsible for sharing local knowledge of community attitudes towards housing, housing need and demand, challenges and barriers to meeting demand, and development opportunity areas; identifying stakeholders; and reviewing and providing input on plan elements. The Advisory Committee will meet approximately 5 times over the course of the planning process.

The Advisory Committee includes the following members:

  • City Councillor Jack Eccles
  • Gregory Sampson, Melrose Planning Board
  • Ellen Connolly
  • Thais DeMarco
  • Jaron Green
  • Charlie Harak
  • Deepak Karamcheti
  • Seamus Kelley
  • Dana LeWinter
  • Gina Martinez
Engagement Campaigns

About Affordable Housing

When most people talk about housing affordability, they simply mean housing that works within their budget. The government considers housing affordable when housing costs do not exceed 30% of a household’s income. When households pay more than 30%, they often must make difficult financial decisions, such as skipping meals or doctor’s appointments to have enough money to pay for their homes. This is called being “housing cost-burdened.”

Housing planners use a specific definition of “Affordable Housing” (with a capital “A” and “H”) when discussing housing policy and development. “Affordable Housing” must cost 30% or less of a household’s income and it may only be rented or sold to income-eligible low- or moderate-income residents. Affordable Housing has restrictions on its deed that preserve affordability for decades or in perpetuity, ensuring that income-eligible households can stay in their communities. Without deed restrictions, housing costs can go up as markets rise, making homes that were once inexpensive now costly. Deed-restricted Affordable Housing protects communities from skyrocketing costs and related displacement.

Eligibility to live in deed-restricted Affordable Housing is based on household income and the number of people in the household, which is usually compared to the regional Area Median Income (AMI) calculated by the US Department of Housing and Urban Development (HUD). The 2020 AMI for the Greater Boston region, which includes Melrose, is $119,000. Under many Affordable Housing programs, households eligible for deed-restricted Affordable Housing must have incomes at or below 80% of AMI. For a household of one, 80% AMI is $66,650; for a household of four, it is $95,200. Some Affordable Housing programs serve households with lower incomes than those.

Affordable Housing can take many forms, including public housing and private Affordable Housing, which is typically built by nonprofit developers or for-profit developers through mixed-income projects. All Affordable Housing requires subsidy, and usually this subsidy comes from the government. Today’s Affordable Housing developments usually require multiple subsidies from all levels of government, as well as private debt and foundation funding, in order to be built. In addition to government-subsidized Affordable Housing, many cities, including Melrose, require market-rate developments to include Affordable Housing under laws often called “inclusionary zoning.” In this case, the market-rate units in each development help to subsidize the Affordable Housing in that development.

Resources

Final Plan: Published February 2022

Webinar #2: Goals, Strategies, Actions, and Development
June 16, 2021

Webinar #1: Existing Conditions, Vision and Goals
December 2, 2020

Fall 2020 Engagement Summary

Asset 2
Continue reading...

Exploring Youth Mental Health Access in North Shore/Cape Ann Communities

Exploring Youth
Mental Health Access

in North Shore/
Cape Ann Communities

This digital report summarizes findings from focus groups, surveys, and in-depth research on the topic of youth mental health in the Cape Ann area of Massachusetts.

Contact

Amy Epstein, Regional Prevention Director, City of Gloucester

[email protected] | 978-325-5272

Report Authors:

Alyssa Kogan, Regional Planning Data Analyst

Elaine Zhang, Public Health Planner

Report Design: Elise Harmon, Digital Communications Specialist

Funding:

regional youth prevention network logo

Project Background

Youth Mental health in North Shore/Cape Ann Communities

Mental health, specifically youth mental health and access to behavioral health services, has become an important priority in the North Shore.

In 2019, the city of Gloucester hosted one of several statewide listening sessions held by Massachusetts Secretary of Health and Human Services Marylou Sudders in order to better understand what barriers and challenges residents face around mental and behavioral health.

Common themes and challenges identified through these listening sessions included lack of mental health providers within the North Shore/Cape Ann Area, insurance, and long wait times for counseling sessions.

The Youth Risk Behavioral Survey (YRBS), which is conducted every two years, assesses health related behavioral issues in youth that contribute to leading of death and disabilities in adults. Survey data from the most recent year (varies for each community since survey is conducted every two years), indicate there are growing mental and behavioral health needs in the region.  As seen in the first graph, high school students within the region report having felt depressed or seriously considered suicide at higher rates than Massachusetts’s average. Regarding substances, high school students within the region report lower rates of current usage for alcohol and marijuana when compared to MA but higher rates of current usage for vaping.

Data: Youth Mental Health on Cape Ann

Data: Youth Mental Health in Cape Ann

The 2019 Beth Israel Lahey Health Beverly Hospital and Addison Gilbert Hospital Community Health Needs Assessment (CHNA) identified mental health as one of the top four priorities in the community benefits service area that includes Gloucester and Cape Ann municipalities (Essex, Gloucester, Manchester-by-the-Sea, Rockport). Mental healthincluding depression, anxiety, stress, serious mental illnesses, and other conditionswas a major issue across all demographics and socioeconomic populations. In fact, mental health was the issue that people in the community struggled with the most (49%). Among the groups, youth and older adults emerged as priority populations most affected by mental health issues. According to the CHNA, youth reported feeling increased pressure to succeed in school activities, challenges with peers due to social media, and formation of positive interpersonal relationships.

The Lahey Hospital Community Health survey indicated that mental health was the issue that people in the community struggled with the most (49%).

Project Overview

The Gloucester Health Department was awarded a multi-year Tower Foundation grant to identify barriers and challenges faced by North Shore/Cape Ann residents, specifically children and youth, when attempting to access mental health services.

As part of that work, the Regional Youth Prevention Network (RYPN) conducted a series of focus groups with area parents and young people to directly hear their views on youth mental health access with the goals of better understanding additional barriers and challenges parents and youth face when trying to access mental health services. The RYPN asked the Metropolitan Area Planning Council (MAPC), Greater Boston’s Regional Planning Agency, to facilitate and develop a report detailing the findings and recommendations from the focus groups.

Types of Mental Health
Access Points

Outpatient care: Covers a wide variety of care settings that are not overnight, and can include private practice, group therapy, community mental health centers, among others

Inpatient care: Admission to a hospital for overnight care

Schools: Can include care provided by school resource officers, adjustment counselors, licensed mental health professionals, or teachers

Community-based organizations: Nonprofit groups that provide local mental health services or alternative learning models

Methods

Focus Group Guide Development:  

Click here for the
focus group questions

Development of the focus group questions was an iterative and collaborative process between MAPC, GHD, and The Regional Youth Prevention Network. MAPC developed a set of draft questions aimed at understanding barriers and identifying resources that helped connect parents and youth to the care they were looking for. These draft questions were shared with GHD, who helped prioritize a second draft of the question set. This second set of draft questions was shared with the Regional Provider Network, who were asked to prioritize questions they felt were most important. Additionally, MAPC and GHD used this network’s expertise to ensure the questions were phrased in a trauma-informed manner to ensure a safe and positive experience for participants. The process resulted in a final set of 10 questions for the focus groups. Questions were adjusted slightly (e.g., changing from “you” to “your child”) for parent and youth focus group to ensure vernacular is understood between groups. See appendix for full focus group guide.

Recruitment:  

Flyer for
recruitment

The target focus group participants were youth and parents who had attempted to access youth mental health services within the last year. GHD worked with their network of stakeholders to recruit the target population for the focus group. MAPC developed a flyer for GHD to distribute to potential participants that provided more details about the focus groups. See appendix for a focus group flyer.  

Focus Group Participation
Qualitative Analysis
COVID-19 Limitations
Data Limitations

Top Five Themes

MAPC identified five primary themes based on a final coding and analysis of the focus group data. Focus group participants mentioned a variety of factors that either prevented them for accessing services or enabled them to do so.  Even as different participants may have described preventive or enabling factors differently, MAPC staff was able to group similar issues into these five major themes described below. For example, barriers to using certain types of insurance or difficulties maintaining continuity of care were often mentioned as barriers to accessing mental health services but can both be linked to an underlying root cause faced by parents and youth, I.e., the challenges of navigating the mental health and health care system.

Lack of Providers

The limited number of youth mental health service providers on Cape Ann is a primary contributing factor to many of the other challenges that focus group participants enumerated, such as long wait times, having to travel far distances to reach a provider or access specialized care. Almost all focus group subsets mentioned insufficient provider availability. The broad extent of this theme suggests that it is a root cause of other barriers to mental health access. School officials noted that when they refer students, unless they have personal connections already established with providers in the area, their students endure long wait times to get to a provider. Many parents noted a shortage of clinicians that specialize in adolescent care (specifically child prescribers), and once they can find a therapist and establish a connection, the clinician often leaves, highlighting an issue with clinician turnover. This also begs the question: What is contributing to such a large clinician turnover in the area; is it low pay, insufficient support, lack of benefits, or something else? This could be an area of future research to discuss directly with providers.

Navigating the System

Navigating the mental health care system was an underlying issue when focus group participants spoke about attempting to access care, particularly in terms of insurance coverage, identifying a clinician that fits the unique needs of families and youth, and continuity of care. One parent focus group participant who works in the field of mental health care said, “If you don’t know how to navigate these systems, and even if you do, you’re still kind of screwed. You know, it’s a lot of work.”

Insurance coverage was the number one barrier parents identified when trying to navigate the mental health system. Parents often spoke about how time consuming it is to find a clinician or provider that meets their needs and accepts their insurance. As a result, some parents mentioned paying out-of-pocket for their child to see a clinician to avoid long wait times. Moreover, parents told of gaps in coverage due to dual insurances. One parent shared that her disabled son is covered by her employer’s insurance as well as MassHealth. Generally, when individuals have dual insurance, the primary insurance is billed first and then MassHealth is billed secondarily if the primary insurance doesn’t cover a specific service. This parent reflected on a recent experience where they attempted to access mental health services and were denied coverage by both their primary insurance and MassHealth.

Continuity of mental health care, or the quality of care over time, was another barrier parents identified when trying to navigate the health care and mental health care system. Parents noted the lack of wraparound services after being discharged from inpatient treatment. Another example of where continuity of care has posed serious barriers for parents and youth is when students transition back to school after being absent for an extended period. Due to siloed communication among sectors, such as health care and schools, schools are often unaware of sensitive situations the student may be experiencing, making it harder for students to assimilate back into the school environment.

Interactions with Coordinators and Clinicians

The manner in which youth and adults felt they were treated by those they sought assistance from in accessing services and those who provided them clinical care emerged as a significant theme.

Focus group participants shared positive experiences if they felt that their needs were understood by those helping them find clinical support or if they developed a personal connection with their provider. Conversely, participants that described feeling a sense of disrespect, condescension, or lack of compassion from such parties reported negative experiences. These negative experiences were widespread among focus group participants. Many shared stories about such interactions across the spectrum of mental health care – within the schools, in outpatient and inpatient settings, and in engaging care coordinators. Some youth specifically lamented a lack of privacy and confidentiality with their outpatient provider. Other words used to describe unfortunate interactions ranged from “dismissive” to “unresponsive” to “rude.”

Although it’s not possible to objectively determine a lack of compassion, there was clearly a perception among youth and their parents that providers did not always treat them in a respectful and compassionate manner, a factor that exacerbated the sense that the system was not accessible to those in need of youth mental health services.  

What We Heard

“I think more teaching around empathy is important…Then you have to go to a school or to whomever to ask for help… their response to you can either be really off-putting or can make you feel really safe. You know, sometimes therapists are so busy, billable by whatever increments, and you got to have their billable rate, you know, at time. Sometimes it’s like a factory. So I think making it almost like a more humanizing experience again. Like, that they want to be there and connect.”

— Parent Focus Group Participant (March 2020)

What We Heard

“It’s kind of like — so I’ve actually had an experience with that before where this one place that my brother and I got therapy at — he’s about eight years younger than me and him and I both had issues with each other. The two people that we saw, the two therapists, would constantly say back and forth information about him to mine and mine to his, tons of HIPAA violations and everything. It’s just like that’s not how you run a therapy place. That’s going to get both the therapy place shut down and the people not getting therapists.”

Youth Focus Group Participant (February 2020)

What We Heard

Female Student: “And it’s also like you’re trying to keep this information confidential and then they go and break that barrier. How are you going to get any help at that rate?”

Male Student: “Yeah and it’s not even things that they have to report, too.”

Youth Focus Group Participants (February 2020)

Role of Schools as an Access Point

The role schools play in responding to mental health issues was a prominent theme mentioned in all focus groups. Perspectives on the role of schools varied based on the respondent (parent, youth, school stakeholder) and school district they came from. Identified school-based barriers included insufficient resources (e.g., not enough staff to handle the volume of students that need mental health support), mental health issues handled in a disciplinary manner, and “cookie-cutter” education curriculums. Youth and parents also shared they often felt there was a lack of compassion and trust from teachers in the public school system when they would report on what they were going through. Schools were also identified as an important facilitator in aiding parents and youth in accessing needed care. Specifically, parents noted schools at times played a key role when there were staff willing to champion and advocate for their child’s specific needs, which in turn helped students meet their interim mental health needs or receive a referral to see an outpatient clinician.

Stigma and Perception of Mental Health

Stigma and the negative perception of mental health illnesses was often a concern of parents and youth when trying to access care. A frequently mentioned source of stigma occurred when youth needed to leave school for an extended amount of time for treatment related to mental health challenges. Parents and youth often mentioned how difficult the transition back into school was, and how they felt they were viewed negatively or treated differently. Parents and youth often reported feeling disrespected by schools when dealing with mental health challenges. One parent said that “the school professionals were really kind of condescending and really made me feel like maybe there’s something I’m not doing right.”

Youth also reported feeling a lack of support from their parents when requesting mental health care. A number of youths shared that their parents refused to believe that their children needed care and expressed fear that their reputation within the community (i.e., workplace, neighborhoods) might be jeopardized. Additionally, participants perceive North Shore communities to be smaller in population and more insular with little privacy “because everyone knows everyone so if you’re in therapy then everyone’s going to know.”

What We Heard

“It’s hard. Because try to be in that kid’s place of trying to go back when, like, everyone knows everything about you. And you are walking down the hall, and yes, they are looking at you. And you are trying to function in a normal place, and you’re a teenager, and that means so much to you. So it’s hard. I think — I don’t know how many of them successfully come back into school and feel good about it.”

Parent Focus Group Participant (March 2020)

Findings

Focus group participants described various points by which they connected with youth mental health care. Below were the four most common access points identified by parents and youth: each highlighting respective barriers and benefits. 

Existing Community Based Organizations

Parents and youth shared examples of how existing community-based organizations or alternative learning models have been able to provide the services that met their needs or connected them to external providers for additional help. Some youth shared that they decided to choose an alternative education pathway when the traditional public-school curriculum did not align with their mental health care needs. Parents who utilized the community-based organizations often noted that they were connected to these organizations through word of mouth or through the recommendation of schools. Parents and youth tended to speak positively about their experiences at existing community-based organization once they were seen.  

Barriers

Benefits

What We Heard

“I had a really good therapist at [provider name redacted]. I just can’t go anymore because of our insurance.”

Youth focus group participant (February 2020)

“As far as [provider name redacted] goes, my son’s been on a wait list there since September. And I’ve had him on a wait list for a month another place in Beverly since the beginning of October.”

Parent Focus Group Participant (March 2020)

“I didn’t want to go to [provider name redacted] because at the agencies like that you see the turnover rate so fast, so they do just decide to leave. And, you know, these kids—that’s what happened. He had a really great therapist, but she went private and kind of had turned away from taking kids.”

Parent Focus Group Participant (March 2020)

Outpatient Care

The most common setting for youth to receive mental health care is in an outpatient setting. Many care touchpoints eventually lead to therapy, whether through direct connections or referrals from school officials, community-based organizations, or inpatient care.

Barriers

Benefits

What We Heard

“And I think there’s a real dearth of available counselors and prescribers and programs in this area. We also did like a three-months DBT workshop, again, in Salem. That’s not something that was offered anywhere locally, so people that have those needs here might be completely unable to access—even if you find something that could help you—completely unable to access that. So I think that’s, in general, a barrier for a lot of people.”

Parent Focus Group Participant (June 2020)

“Yeah, I mean, I feel pretty lucky in that I have pretty decent insurance. That said, nutrition counseling, for example, is maxed out at 12 sessions. Well, someone with an eating disorder can’t stop nutrition counseling after 12 weeks. You know? And the first three months, they need to be seeing that nutritionist every week. So in three months you’re out of your nutrition, so now you’re paying cash at $200 for nutrition counseling. And what do you do here, right? This is your child’s health, so you’re going to try to prioritize that over anything else. Now, what if you—to me, $200 is significant but it’s not the end of the world. To some people, $200 is two weeks of groceries. What do you do now? Or that’s a week’s rent or what have you, and how can they prioritize that over access to… So they’re not going to go to the nutritionist, right? So I can see that overall we’ve managed, but I can see that you don’t have to step down too far for that to be unmanageable.”

Parent Focus Group Participant (June 2020)

“They might send a kid to a program for three days, but that doesn’t address their problems. And then they end up just sending them back into the same program, you know, the same setting that kind of triggered what happened before, and they’re not getting any better. So I guess transition services, so if you do need the help you kind of need someone with you there through the process and not just kind of being, you know, okay, you’re done. You’re cleared now, go home, and then things act up again. That’s a problem.”

— Parent Focus Group Participant (June 2020)

“You see a lot of great progress and support when there are other agencies for [youth] to connect with. And so during these transition periods from middle school to high school to college to a working career, these are still young adults; there’s not enough support, as well as, I think, not enough for kids who might not be doing too bad but still have the potential to really backslide and not reach their potential without some outside assistance.”

— Parent Focus Group Participant (June 2020)

“I reached out to her pediatrician, and he gave me three recommendations, and no one could see her off that list, however, I did get one clinician on the phone who was able to tell me about another agency. And they didn’t have one, but they were able to get me the in-home therapist to do, like, family therapy. And then it got better from there.”

— Parent Focus Group Participant (June 2020)

“You have to have some sort of background knowledge here. If you don’t have any kind of perspective on this problem at all as a parent, you’re really, really underwater. You would have no idea how to go about this. If you don’t know yourself or have friends who know how to navigate things like asking, advocating for the things you need, or know what to advocate for, then I don’t know how you would ever get really what you needed. It would just be dumb luck, really. That’s sort of my sense.”

— Parent Focus Group Participant (June 2020)

“As a parent, just being that annoying person, unfortunately, which puts you in an awkward position, but seems sometimes the parents for the individual is the strongest advocate and support.”

— Parent Focus Group Participant (March 2020)

“The [therapist] that we have now was a complete word of mouth, because I just tell everybody, does anybody know anybody? Does anybody know anybody? And they’re like, ‘Nobody’s taking anybody’.

Nobody’s taking patients, and then somebody gave me the name of somebody who is actually an elderly neighbor’s of mine. And their granddaughter was seeing somebody, and they said, ‘Oh, she sees so and so.’ And so I called and left a message, and I did say ‘I heard about you from so and so.’ And she actually called me back and said ‘do you want to come in tomorrow?’

And she was completely overbooked, but she said, ‘Because you mentioned that you knew somebody, and I really respect that family.’ And so now we’re seeing somebody regularly, but it was not with any help from [a behavioral health organization]. It was not with any help from school. It was just my own desperation of not giving up. And it just feels like there’s nothing to help us.”

— Parent Focus Group Participant (March 2020)

“I would say one of the more positive aspects was once we had someone to work with, then referrals from that clinician were better as we sought to get a more focused or a better connection or once something wasn’t working. But we sort of already had to be in some sort of a system before we could access that knowledge.”

— Parent Focus Group Participant (June 2020)

Schools

The public school system’s role and responsibility in handling youth mental health issues was a prevalent theme across the youth and parent focus groups. From the perspectives of parents and youth, participants felt that the school systems were not accommodating of their mental health needs which resulted, at times, in the disruption of learning. Youth often voiced their frustration around how restrictive traditional public school curriculums are and how the curriculum did not allow enough flexibility for creative learning methods. In response to the prevalence of schools in focus group conversations, MAPC also conducted key informant interviews with school representatives to ensure there was a more nuanced understanding of the barriers.

Focus Group Participants: Barriers

Focus Group Participants: Benefits

What We Heard

“So the counselor at the school was like, ‘Does she have a therapist?’ And I said, ‘No. I don’t even know where to go. Do you have any recommendations?’ And she said she was going to get back to me. I think it was almost three weeks, almost an entire month, I kept asking her, and she never got back to me. So in the meantime things kept escalating, and I was having to leave work every day. And I was on the verge of losing my job.”

Parent Focus Group Participant (June 2020)

“Everybody’s so different and they have their own ways that they need to go but they’ll still punish you if you can’t fit into that way that they want you to fit in. And it does not make sense. And then when you get punished nothing gets fixed, you just get punished and then put back in the environment and set up to fail again. And when you’re expected to fail you’re more likely to fail because they’re expecting it from you.”

Youth Focus Group Participant (February 2020)

“Some teachers are really awesome, like [name redacted] is a really awesome teacher. She made my freshman year so much better because I don’t think I would’ve survived freshman year. I was failing a few classes and…one of the awesome things that she did was she asked what she should know as a teacher about the student and about our lives. And she gave me more leeway, which I really did need because I was really struggling at that point.”

Youth Focus Group Participant (February 2020)

School Officials: Barriers

Inpatient

Youth can receive inpatient care (i.e., admission to a hospital for overnight care), when they experience a mental health crisis. Pathways leading to inpatient care can involve parents, schools, or even the youth themselves.

Barriers

What We Heard

“I have a very similar situation right now with my son, spending almost an entire week in the ER with him after calling 911 for help, and an EMT telling me that he couldn’t help the situation, he couldn’t help that my son and I had a poor relationship and that he didn’t feel that it was an emergency, which was a horrible feeling, for somebody to tell you that when you’re in the middle of a crisis.”

— Parent Focus Group Participant (March 2020)

“And so then they took [my daughter] from [the crisis center] to the ER, and we spent four days in the ER. And it was awful. You know, locked in a room, because you’re in lockdown and being the victim she felt like she was being locked up. It was like she was the criminal. And then finally from there we took an ambulance ride to [another ER] and they had a bed for her. But we got there, it was 6:30 at night, and a nurse came down and met us and then locked us in this little tiny room and we filled out paperwork. They took her and went to this room, a small room also, strip searched her, and then had us locked in that room for two and a half hours with nothing. They said, ‘The doctor’s going to be by.’ We finally went up and said, ‘What is going on? You know, we’ve been doing this forever’…We went on a Friday night. There was nothing all weekend. So come Monday she was done.”

— Parent Focus Group Participant (March 2020)

Recommendations

The focus groups and stakeholder interviews highlighted numerous barriers that parents, youth, and educators face in obtaining access to mental health services, but participants also suggested several potential solutions that build on what is currently working well across the region.

Below are examples, identified from participants, that provide a pathway to drive more systemic changes. The examples also highlight that the region is already making progress which is important to ensure that momentum is sustained. The following recommendations seek to encourage and reproduce the numerous enablers for youth mental health services cited by parents, youth, and school-based staff.

capeann1

Training

Model: Psychological First Aid/Teen Mental Health First Aid/Crisis Intervention Training

At a regional level, school districts and local law enforcement have undergone Mental Health First Aid and Crisis Intervention trainings. In order to ensure that mental and behavioral health issues are handled in a consistent and trauma informed manner, training should continue to be provided for school personnel, law enforcement, and expanded to include first responders.

Initial Action Steps:

  • Schedule two school personnel trainings in 2021
  • Conduct evaluation to assess mental health literacy among school personnel

Recommendation #1: Improve how mental health issues are addressed within public schools

Train all staff and educators on trauma-informed mental health literacy, including understanding warning signs for mental health issues

Action Steps:

  1. Provide regular and refresher trainings for all school personnel that interact with students on a regular basis. Trainings such as Mental Health First Aid and Youth Mental Health First Aid should be provided to all new staff. Refresher courses should be offered for staff every 2 years following their initial training.
  2. Provide targeted trainings for educators and other school officials around mental health issues that are more prevalent and unique to each high school (i.e., suicide, substance use, anxiety, etc.).
  3. Provide training on trauma-informed care interventions geared specifically towards educators.
  4. Conduct biennial evaluation to assess mental health literacy among school staff and educators.

Why?

Parents and school officials often mentioned the need for increased mental health literacy among staff and teachers that interact with students on a daily basis. With increased mental health literacy among staff and educators, the hope is that responses to mental health issues happen in a timely, effective, and compassionate manner.


Create multiple systems of supports for youth and expand current support systems
Secure funding to provide multiple levels of support
Establish and enhance meaningful and trusting relationships with existing community-based organizations and new potential partners
capeann5

Support Systems

Model: Gloucester Youth Leadership Council (GYLC)

In wading through the mental health system and navigating the challenges of either experiencing a mental health condition or having a family member with a mental health condition, focus group participants, particularly parents, expressed a desire to connect with other parents both as a source of support and empowerment.

The Youth Leadership Council, convened by the Gloucester Health Department, is a group of teens that works to make positive impacts in the community around issues that impact teen health, also creating a space for teens to connect, share experiences, and have an impact.

Initial Action Steps:  

  • Invite participation from Cape Ann youth for the next four council meetings
  • Test model for incentivizing participation
navigation

Navigation

ModelThe Navigator Role

Focus group participants mentioned how difficult it is for them to navigate the mental health care system. Issues related to navigation include insurance, finding the right provider they connect with, and long wait times. Focus group participants often voiced their desire for a “one stop shop” that would help them navigate all these barriers. Currently, there is a pilot Navigator Role that is aimed at helping families navigate barriers when trying to access mental health care. Although it is a pilot position, the Navigator Role presents several opportunities for expansion and improvement.

Initial Action Steps:

  • Convene the Regional Youth Prevention Network and develop an updated and comprehensive job description of The Navigator to ensure this position is fulfilled by a highly skilled candidate.
  • Establish standardized data collection methods to facilitate data-informed decisions in the future.

Recommendation #2: Create supports for parents and youth to navigate the mental health care system

Provide support for parents navigating the mental health care system

Action Steps:

  1. Expand the current navigator role to include additional positions that are responsible for the following tasks:
      • Comprehensive case management (including next steps, follow-up, check-ins etc.)
      • Intake and triage
      • Ensuring warm hand offs
  2. Convene all navigators or people in similar roles within the region to create a Learning Community
  3. The Regional Youth Prevention Network should convene all appropriate stakeholders to develop an updated and comprehensive job description to ensure this position is fulfilled by a highly skilled candidate.
  4. The navigator should have access to updated information about provider availability and insurance information, community-based programs, specialty programs, alternative schooling programs, inpatient programs, etc.
  5. Establish a standardized way for the Navigator to collect demographic data from parents and youth (e.g., insurance provider, type of services they are looking for, age, municipality, etc.), provider information (e.g., referral processes, insurance information) to facilitate data-informed decisions in the future.
      • Utilize data to conduct continuous quality improvement efforts such as improving process in how Navigator handles referrals from start to finish, identifying which providers that might need to be removed from list, etc.
      • See Navigator survey results for more information
  6. Work with the Regional Youth Prevention Network and school districts to continue to promote the Navigator position as a resource for families.
  7. Put this information on a website where parents and youth can see waitlist time updated in real time.

Why?

A prominent theme from the focus groups was the difficulty parents faced in trying to obtain care for their child.

Facilitate a space for parents and youth to connect and organize around their challenges and experiences
capeann4

System Coordination

Model: The Regional Youth Prevention Network

Continuity of care was a key component that focus group participants cited was lacking from their mental health care experiences. They often mentioned that the health care system felt disjointed, with minimal support for patients in ensuring sustainable and comprehensive care.

The Regional Providers Network convenes providers, lending itself to coordination and communication amongst providers in the area. This Network can be bolstered to enhance their authority and tap into their knowledge and potential.

Initial Action Steps:  

  • Develop 5-year Goal for Network
  • Schedule bi-monthly meetings for the Network

For more action steps, click here for Recommendation 3.

Recommendation #3: Formalize comprehensive collaboration and communication within the mental health care space

Continue to expand and improve on the Regional Youth Prevention Network

Action Steps:

  1. Regular convenings for the Network to provide formal and informal opportunities for people to connect and learn
  2. Establish a collaborative workplan/agenda that the Provider Network would like to achieve on a yearly basis
  3. Regular assessment to determine if the appropriate partners are at the table
Create a system to unite disjointed settings and providers
capeannrep

Provider Network

Model: Children’s Friend and Family

High turnover of clinicians and providers and long wait times were often the root of frustration for parents, youth, and key informants. Parents and youth shared how frustrating it is to form a trusting relationship with a provider or clinician only for them to leave. Key informants also noted that due to high turnover, it creates gaps in continuity of care and a repetitive cycle of staff needing to build trust with cohorts of students.

According to key informant interviews, some community based organizations, such as Children’s Friend and Family, have remained consistently successful in retaining providers and clinicians. This presents opportunities for learning and regional collaboration on how to increase and retain the number of providers in all settings.

Initial Action Steps: 

  • Conduct research with outpatient clinicians (both in private and community-based settings) to determine what could help with retention, reduce turnover, and onboard new clinicians.
  • Backed by findings and research, develop a local policy agenda to advocate for change at state level

For more action steps, click here for Recommendation 4.

Recommendation #4: Increase the number of providers in all settings

Increase the number of providers in all mental health care settings because one of the most prevalent barriers to mental health care was long wait times

Action Steps:

  1. Incentivize outpatient clinicians to work in the North Shore (e.g., subsidy for student loans to attract more people into the field)
      • Actively recruit bilingual and multicultural clinicians
  2. Conduct research with outpatient clinicians (both in private and community-based settings) to determine what could help with retention, reduce turnover, and onboard new clinicians.
      • Backed by findings and research, develop a local policy agenda to advocate for change at state level
  3. Implement more sustainable funding mechanisms and billing
      • Establish reimbursement rates that ensure mental health and substance use providers to ensure participation with health plans
  4. Engage in conversations with local pediatric doctor’s office to explore implementing team-based care, including community-based supports.
  5. Promote effective use of technology to increase accessibility of the current available providers.
  6. Develop career ladders and opportunities for new clinicians and providers, peer mentorship programs, specifically for individuals already in communities
capeann6

Literacy

Model: North Suffolk Public Health Behavioral Health Working group

Promoting mental health literacy to the general population emerged as a key recommendation in order to reduce the frequently mentioned themes of stigma and negative perceptions of mental health. While a local model did not emerge in the research, there are many agencies and organizations within the region that have the influence and authority to promote and normalize a more modern and less antiquated view of mental health issues. For example, the Behavioral Health Working Group from the North Suffolk Public Health Collaborative, recruited and trained youth to deploy a social media campaign aimed at reducing stigma around mental health within the community. This model can be applied to the North Shore/Cape Ann Communities since the foundation is already in place (I.E. The Youth Leadership Council).

Initial Action Steps:  

  • Mobilize the youth leadership council to create social media campaigns to promote a normalized and holistic concept of what mental health constitutes, including culturally appropriate media and outreach campaigns targeted at immigrant families.
  • Conduct regular outreach campaigns within schools to promote and encourage that all the services provided by a school-based clinician, adjustment counselor, school resource officer, etc. are available to students, irrespective of severity of mental health issues.

(Also see Recommendation #1, above)

Recommendation #5: Promote mental health literacy to the general population to reduce stigma and improve perceptions of mental health

Promote and normalize a more modern and less antiquated view of mental health issues

Action Steps:

  1. Mobilize the youth leadership council to create social media campaigns to promote a normalized and holistic concept of what mental health constitutes.
      • Develop culturally appropriate media and outreach campaigns targeted at immigrant families
  2. Conduct regular outreach campaigns within schools to promote and encourage that all the services provided by a school-based clinician, adjustment counselor, school resource officer, etc. are available to students, irrespective of severity of mental health issues.
  3. Promote and advertise more holistic examples of self-care
Combat cultural fear and stigma

Appendix

Navigator Survey Results  

GHD is currently piloting a Mental Health Navigator position with support from an existing community-based organization. The Mental Health Navigator assists parents and youth by connecting them with a mental health provider that accepts their insurance coverage. Additionally, the navigator works to ensure that the mental health provider is a good match for the parent or youth’s unique needs, and that the wait time is manageable. 

Since the start of this pilot position, the navigator has received a total of 52 referral requests. Referral requests the navigator received were often from parents calling on behalf of their child or parents calling after being referred from an existing provider. The navigator has been able to refer everyone to at least one mental health provider fitting their needs; in some cases, they have been able to provide more than one option. Currently, the navigator works from a list of 53 mental health providers that are located throughout Cape Ann and North Shore communities, primarily Beverly, Danvers, Gloucester, Ipswich, Manchester by the Sea, Peabody, Salem, and South Hamilton.  

Based on data collected by the navigator, of the 53 mental health providers that the navigator utilizes, 63% of providers accept some form of public insurance or private insurance and 47% of providers accept both public and private insurance. Tufts Public Health Plan (MassHealth) is the most accepted public insurance option, and Blue Cross Blue Shield is the most accepted private insurance option.  

Post-Focus Group Survey Results  
Key Informant Interviews with School Officials

1 E. McCance-Katz & C. Lynch. Guidance to States and School Systems on Addressing Mental Health and Substance Use Issues in Schools. SAMHAS. July 1 2019.

Continue reading...

Somerville Art Space Risk Assessment Study

IMG_20200911_133331
Somerville Art Space Risk Assessment Study

Somerville Art Space
Risk Assessment Study

MAPC is working with the City of Somerville to develop an arts space assessment strategy that explores how municipal policies affect the sustainable operations of spaces where artists produce and disseminate their work.

The final report will contain an analysis of existing policies and programs and will recommend actions that the City and partners can take to strengthen and grow facilities for production and dissemination of arts and culture in Somerville, leading to a thriving arts and cultural life for all.

Read the Report

Download the PDF to read the final report.

Stay up to date

Sign up for our email list and you’ll be the first to know when we release the results of our study!

Public Forum

MAPC and the Somerville Arts Council hosted a public forum on the draft Somerville Art Space Risk Assessment on January 19, 2022. Attendees learned about the findings of the assessment and heard about policy recommendations to support Somerville’s art spaces, arts organizations, and artists.

Did you miss the forum? Download the materials below!

Background

Somerville has one of the highest concentrations of artists per capita of any city in the country, and it continues to serve as a regional center for jobs in the arts and culture sector.

This sector can continue to be an important asset driving economic and civic vitality, but only if policies are put in place so that the spaces where people produce and disseminate their work are able to proliferate.

A major goal of SomerVision 2040 is to increase the ratio of jobs to workers from 1:2 to 1:1. The arts and culture sector can help grow these jobs by taking actions to “foster a creative economy, and promote and attract innovative businesses to Somerville, including companies focused on design, music, film, or multi-media (Goal 1: Policy A. Action 3).” And “Encourage developers to build non-profit performance/exhibit spaces into their projects (Goal 2: Policy B. Action 3).”

The City of Somerville has taken steps toward these goals by reforming its zoning code to encourage the preservation and development of spaces for artists to live, work, and present their projects. Starting with the creation of the Union Square Arts Overlay District in 2009, Somerville has established definitions of artist spaces, streamlined requirements for developing arts-related uses, and mandated that future commercial development (especially in Transit Oriented Districts) set aside 5% or more of gross square footage to arts uses. These changes were further refined in the new, citywide form-based zoning ordinance enacted in December 2019.

However, Somerville continues to grapple with concerns about the loss of existing spaces for creative workers despite these efforts. The city’s proximity to Boston and Cambridge and the construction of the Green Line extension have increased development pressure in the city. According to the Union Square Neighborhood Plan, the next 20-30 years are likely to bring 6.875 million square feet of new development.

In addition, the COVID-19 pandemic and the social distancing measures required to manage its impacts are raising a new series of challenges and opportunities for the long-term viability of creative work and presentation spaces.

Deliverables

MAPC is developing a risk assessment framework to help the City identify at-risk spaces, measure the likely impact of existing zoning on preservation of these spaces, and identify opportunities to better align policies and programs to incentivize the preservation and development of arts production and dissemination spaces. Through interviews with key stakeholders, an analysis of existing data, and the collection of new data through surveys of artists and organizations occupying these spaces, MAPC will establish a baseline risk assessment for Somerville that will inform recommendations for policies and programs to mitigate the further loss of these spaces.

Partners

  • The Somerville Arts Council
  • Somerville Mayor’s Office of Strategic Planning and Community Development (OSPCD)
  • SomerStat, the Mayor’s Office of Innovation and Analytics
Continue reading...

Regional Immigrant Entrepreneur Storytelling Project

Adaptation, Community, and Identity

Elevating the Stories and Presence of Asian Immigrant Entrepreneurs
across the Region

About Project

In 2019, the MAPC Economic Development Team conducted outreach to the Asian immigrant entrepreneur community in Quincy as part of a municipal small business study. During this outreach, the team worked with Quincy Asian Resources Inc (QARI), a local non-profit that focuses on providing resources for primarily the immigrant Asian community of Quincy and the region.

The feedback collected during this process anecdotally told a story of a thriving business community in Quincy bolstered by immigrant East Asian small business owners who struggled to find services that met their needs at the municipal level. Additionally, as MAPC wrapped up the outreach phase of the small business study, an unthinkable crisis occurred in the community. The COVID-19 pandemic not only led to xenophobic responses to the East Asian owned businesses in Quincy, but these businesses were also severely affected by the social distancing measures put in place.

The xenophobia unleashed in Quincy during the pandemic highlights key challenges to achieving racial equity in Quincy and the entire MAPC region. Between 1990-2016, there has been a 350,000 person increase in Greater Boston’s Asian American population. This is a growing population that needs support and access to local government services, but today access to culturally-responsive services and representation amongst decision-makers continues to be a challenge among Asian communities. Discrimination pre-dates the public health crisis, and with the arrival of COVID-19, has led to xenophobia and violence of words and actions, such as those we have seen in response to the fears of COVID-19 being a “Chinese Virus.”

In response to the unprecedented challenges of both COVID-19 and the social barriers that existed prior to the pandemic, MAPC is initiating a regional storytelling project that focuses on stories of resilient Asian immigrant entrepreneurs. The goal is to provide a platform for immigrant entrepreneurs of Asian descent to share their experiences as small business owners both before and during COVID-19. While aspects of the project and the policy recommendations will be regional in nature, it is important that stories are told in the context of local issues. The first phase of this project focused on Quincy.

Advisory Committee

Quincy Asian Resources Inc (QARI)

Boston Chinatown Neighborhood Corporation (BCNC)

Asian Community Development Corporation

Chinatown Main Streets

In response to the unprecedented challenges of both COVID-19 and the social barriers that existed prior to the pandemic, MAPC is initiating a regional storytelling project that focuses on stories of resilient Asian immigrant entrepreneurs. The goal is to provide a platform for immigrant entrepreneurs of Asian descent to share their experiences as small business owners both before and during COVID-19. While aspects of the project and the policy recommendations will be regional in nature, it is important that stories are told in the context of local issues. The first phase of this project started in June 2020 and focused on Quincy. You can download a full copy of the report here(Chinese) (Vietnamese)

We are actively exploring partnerships and locations for our second phase to start in Summer 2021. If you are interested in discussing in working with us or want more information, please contact Economic Development Planner II, Jennifer Emiko Kaplan.

Data Analysis

To understand immigrant entrepreneur communities in Greater Boston, MAPC analyzed population demographics and business data to identify the locations of immigrant communities which are also host to concentrated areas of immigrant-owned businesses. As part of the analysis, we identified “Immigrant Entrepreneur Communities” as well as, in particular, “Asian Immigrant Entrepreneur Communities.”

Click here to learn more!

Asset 3

Video-Lets

Interviews from Small Business Owners
in Quincy

Hear the stories of three business owners in Quincy, that illuminate the city’s development as a center of Asian-American entrepreneurship and business development. Through a collaboration with filmmaker, Daphne Xu, the interviews shared by Jim Mei, Chris Yee, and Lorraine Tse, highlight the larger trends and context relevant to the ongoing challenges of accessing resources, lack of support, and the impacts of COVID-19 on the Asian-owned business community. Learn more!

Video 1

A photographer and hair stylist, Jim Mei had served Quincy’s community for twenty years when the pandemic hit. Hear his reflections on his life and work in Quincy.  

Video 2

Chris brought his Lion Dance studio to Quincy from Lowell to connect with its strong Asian immigrant communityFaced with lost revenues and high rent, he has struggled to stay in Quincy. 

Video 3

Lorraine’s Sunshine Travel Agency has expanded the Asian immigrant community’s access to travel opportunities and provided language services to the region. Hear about her creative pivots during the pandemic.

Data Analysis

To understand immigrant entrepreneur communities in Greater Boston, MAPC analyzed demographic data from the U.S. Census. While Census data cannot give us a complete picture of all the vibrant and diverse immigrant communities in Massachusetts, we started by identifying areas where the largest proportion of residents report owning their own business, being born outside the US and/or speaking a language other than English at home, and identify themselves as Asian. We identified regions with the highest proportion of residents with these and other indicators of being Asian immigrant entrepreneurs.

The region combining Quincy and Milton had the highest proportion of Asian immigrant entrepreneurs per capita. About a quarter of Quincy’s population and about one in twenty residents of Milton speak an Asian language at home. In both Quincy and Milton, the most-represented Asian ethnicity is Chinese followed by Vietnamese.

The seven regions with the next-highest estimated proportion of Asian immigrant entrepreneurs are the following:

  • Malden and Medford
  • Newton and Brookline
  • Waltham, Lexington, Burlington, Bedford, and Lincoln
  • Randolph, Norwood, Dedham, Canton, and Holbrook
  • Quincy and Milton
  • Wayland, Weston, Wellesley, Needham, Dover, Westwood, and Sherborn
  • Lowell

We also identified regions with high rates of immigrant entrepreneurs of any race or ethnicity per capita. Six of the eight regions with the highest proportion of Asian immigrant entrepreneurs also fell into the eight regions with the highest proportion of immigrant entrepreneurs of any race or ethnicity. The region combining Framingham, Marlborough, and Natick had the highest estimated proportion of immigrant entrepreneurs. Other regions with high shares of immigrant entrepreneurs are the following:

  • Somerville and Everett
  • Revere, Chelsea, and Winthrop
  • Malden and Medford
  • Newton and Brookline
  • Waltham, Lexington, Burlington, Bedford, and Lincoln
  • Randolph, Norwood, Dedham, Canton, and Holbrook
  • Quincy and Milton

PUMAs by percent population Asian Immigrant Entrepreneurs

Norfolk County (Northeast) Quincy and Milton: 1.3% +/- 0.3% are Asian entrepreneurs who are either foreign born or speak a language other than English at home.

    • In Quincy, more than 25% (25.7 +/- 1.2%) of the population speaks an Asian language at home (ACS 2014-2018). The most-represented Asian ethnicity is Chinese, followed by Vietnamese.
    • In Milton, only 5.4% of the population speaks an Asian language at home. The most-represented Asian ethnicity is Chinese, followed by Vietnamese (data from 2010).

Norfolk (Northeast) & Middlesex (Southeast) Counties (West of Boston): 0.48 +/- 0.15% of residents are Asian entrepreneurs who are either foreign born or speak a language other than English at home.

    • Wellesley: 8.4 +/- 1.0% of residents speak an Asian language at home.
    • Needham: 5.5 +/- 0.96% of residents speak an Asian language at home.
    • Wayland: 7.7 +/- 1.4% of residents speak an Asian language at home.
    • Westwood: 6.5 +/- 1.7% of residents speak an Asian language at home.
    • Weston: 5.7 +/- 1.8% of residents speak an Asian language at home.
    • Dover: 4.6 +/- 2.0% of residents speak an Asian language at home. The most-represented Asian ethnicity is Chinese, followed by Korean.
    • Sherborn: 2.51% +/- 1.4% of residents speak an Asian language at home.
    • In each municipality, the most-represented Asian ethnicity is Chinese, followed by Korean.

Norfolk County (Central)—Randolph, Norwood, Dedham, Canton & Holbrook: 0.46 +/- 0.16% of residents are Asian entrepreneurs who are either foreign born or speak a language other than English at home.

    • Randolph: 9.5 +/- 1.7% of residents speak an Asian language at home. The most-represented Asian ethnicity is Vietnamese, followed by Chinese.
    • Dedham: Less than 5% of residents speak an Asian language at home. The most-represented Asian ethnicity is Chinese, followed by Filipino.
    • Holbrook: The most-represented Asian ethnicity is Vietnamese, followed by Filipino.
    • Canton: The most-represented Asian ethnicity is Chinese, followed by Vietnamese.
    • Norwood: The most-represented Asian ethnicity is Chinese, followed by Filipino.

PUMAs by percent population Asian Immigrant Entrepreneurs

Middlesex County—Waltham City, Lexington, Burlington, Bedford, and Lincoln Towns: 0.75 +/- 0.21% of the population are Asian entrepreneurs who are either foreign born or speak a language other than English at home.

    • In Lexington, 18% +/- 1.4% of the population speak an Asian language at home.
    • In Bedford, 11 +/- 2.2% of the population speak an Asian language at home.
    • In all cities and towns in the PUMA, the most-represented Asian ethnicity is Chinese, followed by Korean (data from 2010).
    • The lowest concentration of people speaking an Asian language at home exists in Lincoln, where 5.4 +/- 2.4% of residents speak an Asian language at home.

Middlesex (Southeast) & Norfolk (Northeast) Counties—Newton City & Brookline Town: 0.58 +/- 0.20% of residents are Asian entrepreneurs who are either foreign born or speak a language other than English at home.

    • Brookline: 12% +/-1.2% of residents speak an Asian language at home (ACS 2014-2018).
    • Newton: 10% +/- 0.75% of residents speak an Asian language at home (ACS 2014-2018)
    • In both municipalities in the PUMA, the most-represented Asian ethnicity is Chinese, followed by Korean (data from 2010).

Middlesex County (East)—Malden % Medford Cities: +/- 0.18% of residents are Asian entrepreneurs who are either foreign born or speak a language other than English at home.

    • Malden: 19% of residents speak an Asian language at home.
    • Medford: 6.5 +/- 6.5% of residents speak an Asian language at home.
    • In both municipalities, the most-represented Asian ethnicity is Chinese, followed by Vietnamese.

Middlesex County (South): Framingham, Marlborough, & Natick: 0.46 +/- 0.17 of residents are Asian entrepreneurs who are either foreign born or speak a language other than English at home.

Past Events

Film Premiere: Quincy, from a distance 电影首映

March 3, 2021 | 7:30PM 3月3日星期三晚7:30

The debut of three video-lets created by filmmaker Daphne Xu. This series documents the lived experiences and strength of three Asian Small Business Owners in Quincy – a Salon owner, a Lion dance instructor, and the CEO of a travel agency.

Panel Discussion: Analysis and Policy Recommendations 小组讨论

March 17, 2021 | 3:30PM 3月17日下午3:30

A panel discussion joined by Daphne Xu and our community partners, Asian Community Development Corporation (ACDC), Boston Chinatown Neighborhood Center (BCNC), Chinatown Main Street, and Quincy Asian Resources, Inc (QARI) to discuss how we can increase support for Asian immigrant entrepreneurs amidst the ongoing crisis and the rise of Asian American hate crimes throughout our country.

Panelists
  • Jeena Hah, Director of Community Programs and Design, Asian Community Development Corporation 亚美社区发展协会社区规划与设计主任
  • Debbie Ho, Executive Director, Chinatown Main Street 华埠主街执行董事
  • Daphne Xu (徐乙漾), Filmmaker and Director of “Quincy, from a Distance” 影制片人和“Quincy, from a Distance”(瞭望昆西)总监
  • Philip Chong, Executive Director, Quincy Asian Resources, Inc. 昆西亚洲资源协会执行董事
  • David Zou, Board of Directors, Quincy Asian Resources, Inc. 昆西亚洲资源协会董事会
  • Ben Hires, CEO, Boston Chinatown Neighborhood Center 波士顿华埠社区中心首席执行官
Asset 10
Asset 3
Continue reading...

Manchester-by-the-Sea 40R

Click to enlarge photo
Manchester-by-the-Sea 40R
Manchester-by-the-Sea

40R Smart Growth Development in the Limited Commercial District

Click to enlarge photo

Updates

Many thanks to everyone who shared their vision for Manchester’s Limited Commercial District!

Over 225 people completed the survey about priorities for the area. You can view a summary of the survey results here, and a full list of comments received through the survey here. The survey followed a virtual discussion on September 24 that was attended by nearly 70 people. The session began with an overview of Manchester’s Limited Commercial District and 40R smart growth zoning, followed by a live question and answer session. If you missed the session, you can view the presentation here. A recording of the meeting is available here, or click here for a summary of questions and responses.

The project team has also conducted stakeholder focus groups and interviews; a summary and key takeaways can be found here.

The project team will use this input to develop zoning concepts that will be shared with the community in December. Stay tuned for more information!

About the Project

Manchester is embarking on a planning process to rethink its Limited Commercial District (the area north of Route 128) and to proactively plan for mixed-use, mixed-income development. This would advance two principal goals of the 2019 Master Plan: increase Town revenue through planned development in that area of town, and support a diversity of housing options throughout town.

To achieve these goals, the town is exploring a 40R Smart Growth Overlay District, which is a state program that encourages cities and towns to implement zoning that allows compact, mixed-income, by-right development in areas with existing or planned infrastructure and adequate access to services. A 40R district must be primarily residential, must allow a certain amount of housing density, and must include at least 20% affordable units; it can include comprehensive development and design standards to ensure that new development is consistent with the town’s vision for the area. As an incentive, the state makes payments directly to towns that have successfully adopted a 40R district, as well as additional payments after new housing is built in the area.

A project working group, made up of representatives from Boards and Committees in town, will take an active role in guiding communications and assisting with community outreach. Manchester has partnered with the Metropolitan Area Planning Council (MAPC), Greater Boston’s regional planning agency, to provide technical assistance for this project.

Timeline

  • September 2020: Vision and goals for the district
  • October-November 2020: Zoning concept and initial recommendations
  • December 2020 – January 2021: Draft zoning language and design guidelines
  • April 2021: Zoning will be considered at Town Meeting

At each of these stages, there will be virtual engagement to share progress and to seek feedback from the community. See the “updates” section at the top of this page for information on upcoming opportunities to learn more and share your thoughts.

Past Events

Virtual Open House
September 24, 2020

To kick off the planning process, the Town held a virtual discussion on September 24. Many thanks to the nearly 70 people who attended! The session began with an overview of Manchester’s Limited Commercial District and 40R smart growth zoning, followed by a live question and answer session.

Planning Board 40R Community Discussion
September 24, 2019

Building on the recommendations from the 2019 Master Plan, Planning Board hosted a community meeting to discuss the possibility of a 40R district in town.

Continue reading...